Body Fat Percentage: Complete Guide
Track Your Weight Trend, Not Your Daily Weight
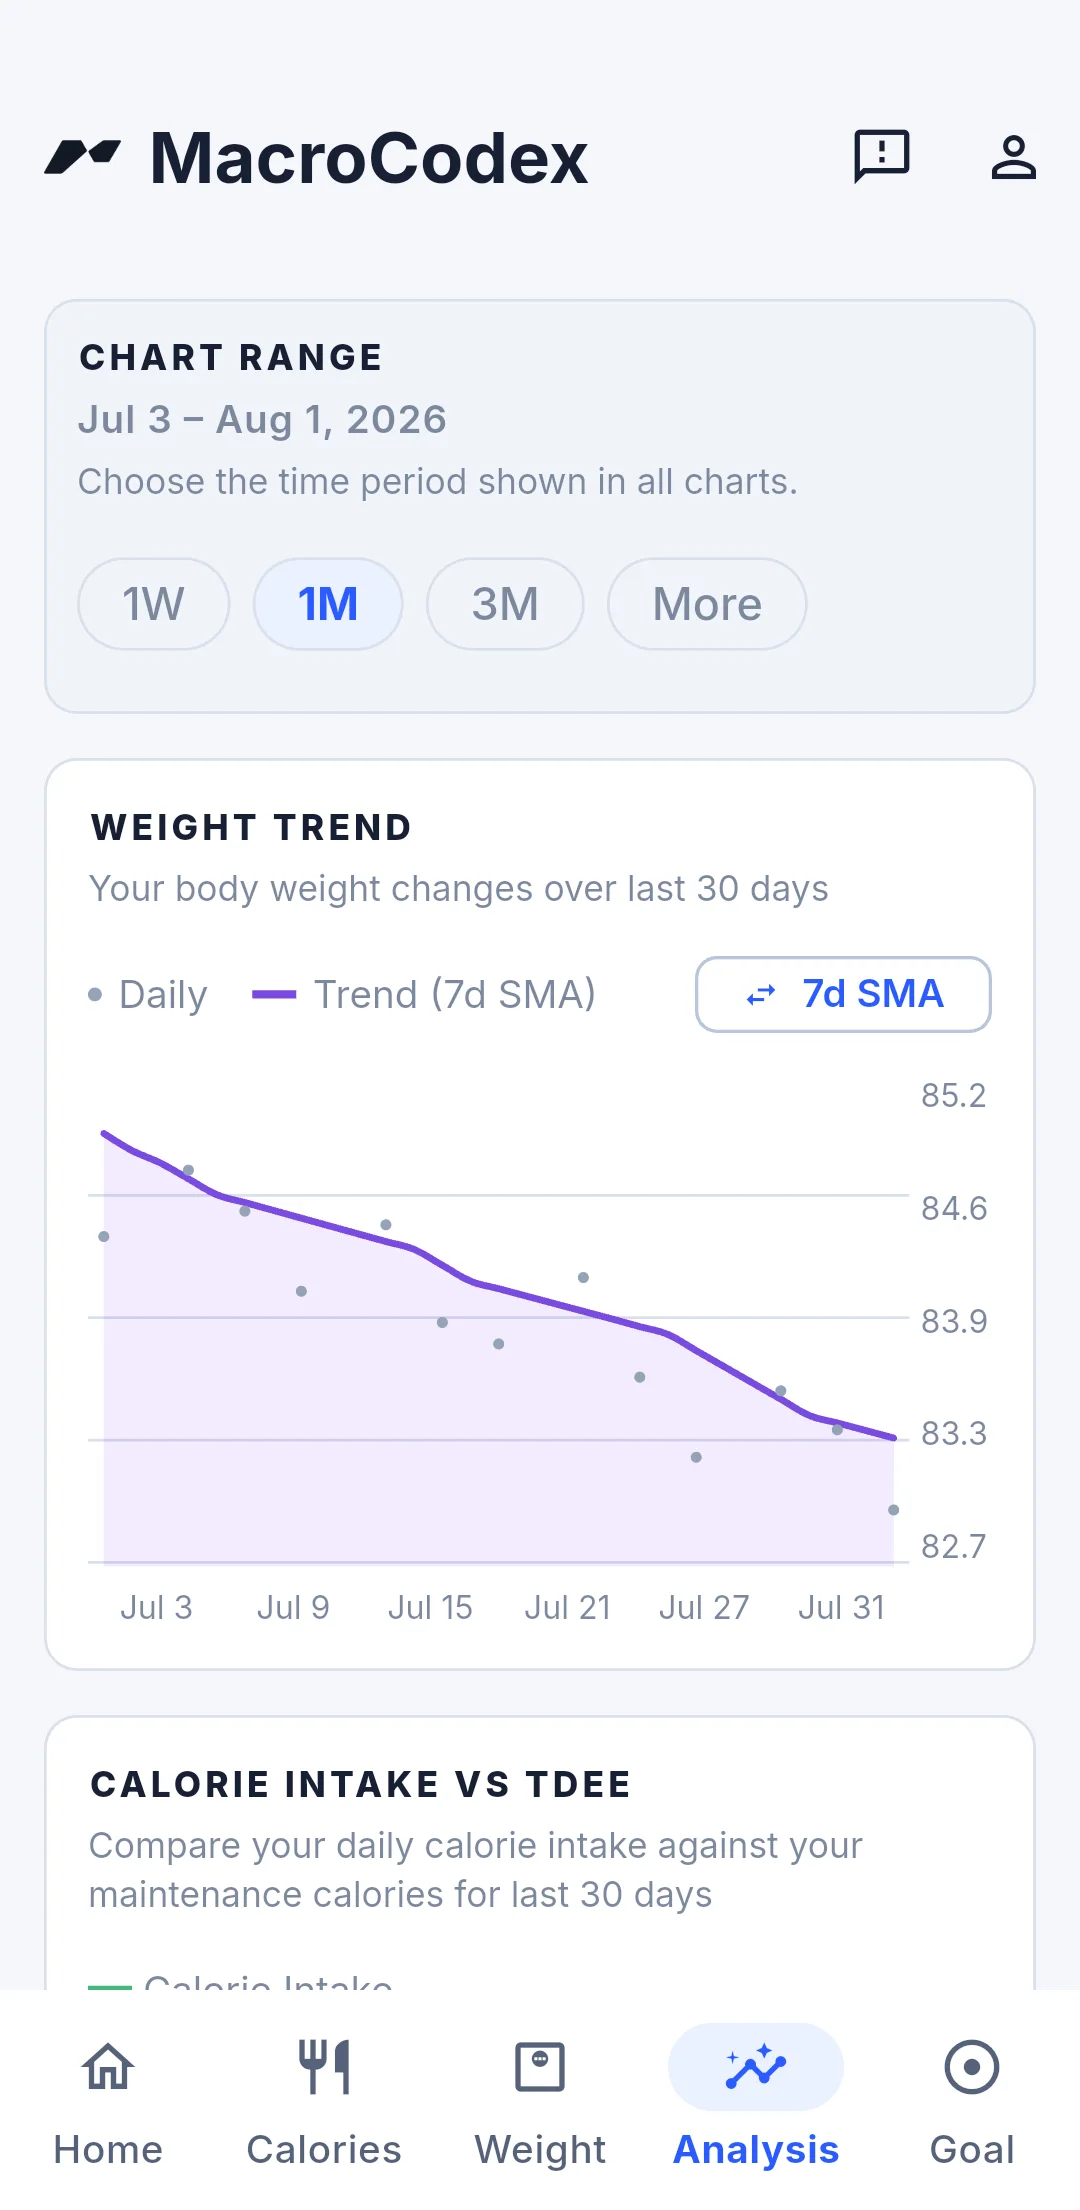
Stepping on the scale every morning can be incredibly frustrating, mostly because our weight naturally bounces around. It's completely normal for your weight to shift over the course of a single day or week simply because of water retention, recent meals, and glycogen levels. Instead of stressing over those daily ups and downs, it's much more helpful to look at the overall trend over several weeks.
Why bodyfat% matters?
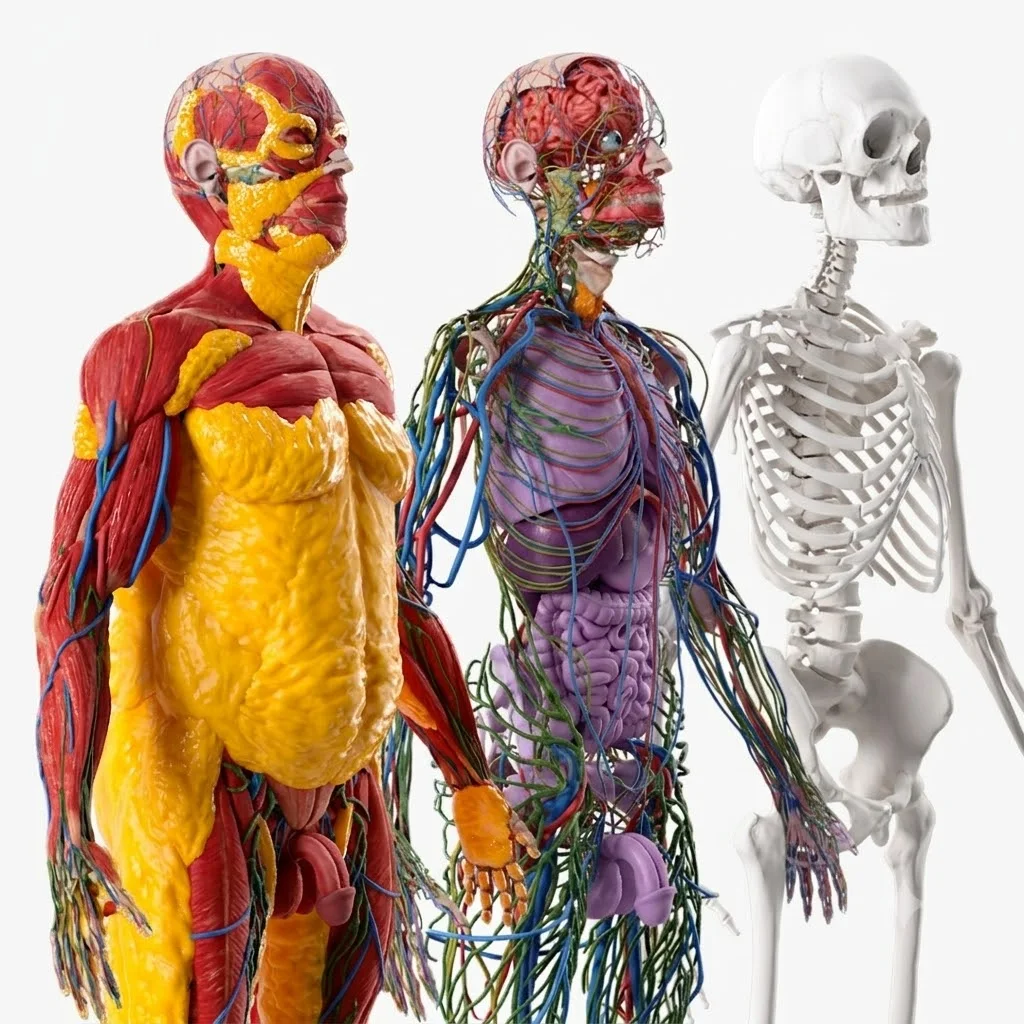
Staring at the scale and obsessing over a single number is an easy trap to fall into, but that weight doesn't tell the whole story. Your body is far more than just a single lump of mass. Instead, it is split into two main parts: fat mass and lean mass. Fat mass is pretty self-explanatory, while lean mass is everything else, including your muscles, bones, organs, and water weight.
Tracking both your total weight and your body fat percentage reveals the actual ratio between these two components. This gives you a much clearer understanding of your true baseline and lets you accurately measure the quality of your progress over time.
Take a look at the image below. Both men stand at 180 cm (5'11") and weigh 80 kg (176 lbs). Despite sharing identical stats, one looks soft and out of shape, while the other looks lean and athletic. The deciding factor here is their body fat percentage.
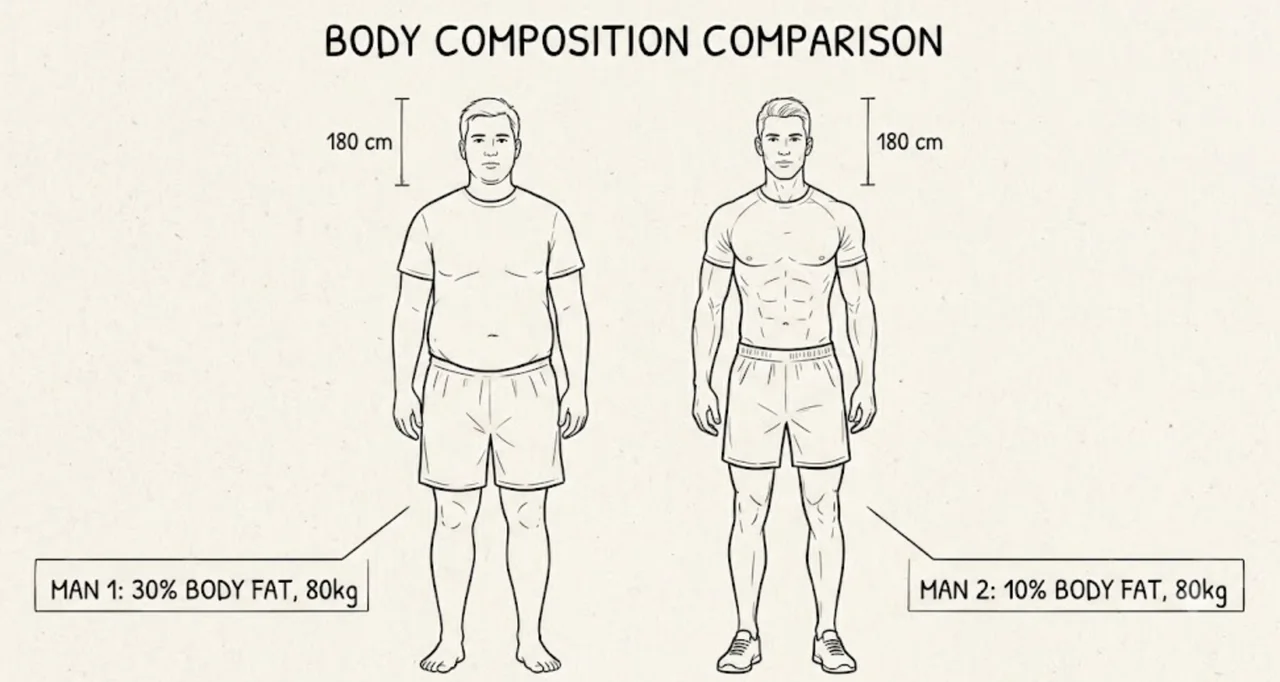
Man 1 carries a higher body fat percentage of 30%. This means 30% of his total weight comes from fat, leaving the remaining 70% as lean mass.
Man 2 sits at a much lower body fat percentage of 10%. Only 10% of his weight is fat, while a massive 90% is lean mass.
These numbers make their physical differences immediately obvious. For Man 1 to build a leaner, more athletic build, he needs to focus on dropping fat while packing on lean mass.
True body transformation isn't just about moving the scale up or down. It's about shifting your overall body composition to find the right balance between fat and lean tissue.
Look at it this way. If someone called you and only shared their height and weight, you would have almost no idea what they actually looked like in person. But if they added their body fat percentage to the mix, you'd immediately have a highly accurate mental picture of their build.
Tracking your body fat percentage is highly valuable, but finding an accurate measurement can be incredibly frustrating. The reality is that most common methods are highly inconsistent.
Smart Scales and Smartwatches
Just a quick heads-up: don't rely too heavily on consumer-grade smartwatches and scales. They're incredibly convenient, sure, but their body fat estimates are notoriously off. Basing your fitness decisions on these numbers can easily steer you in the wrong direction. There's a reason clinical equipment costs thousands of dollars. You simply can't squeeze that level of technology into a gadget that costs less than a grand.
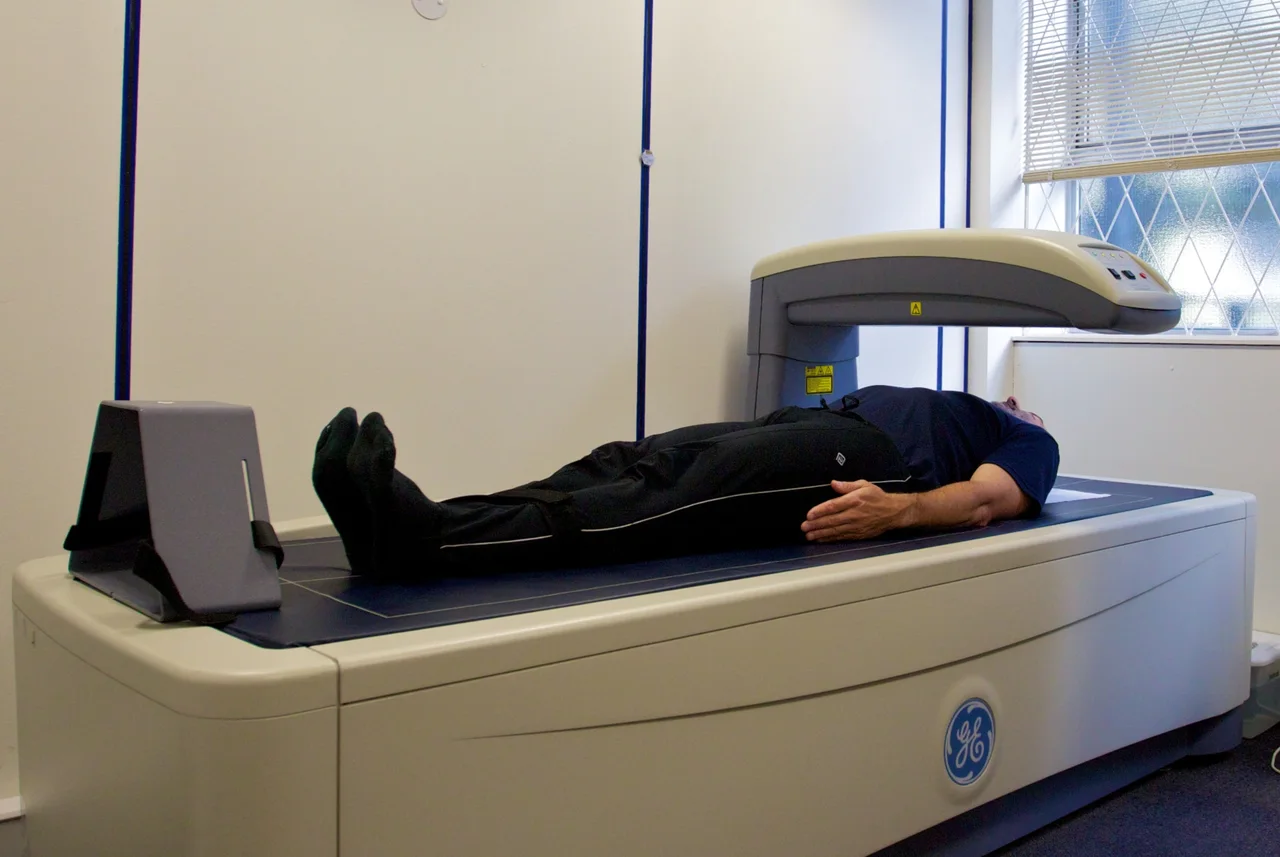
Finding a proper scan is actually pretty straightforward. If you search for "DEXA scan near me", you'll likely find a local clinic or gym offering them for a reasonable fee. I'd recommend calling ahead to confirm the pricing first, since different facilities can charge wildly different rates for the exact same scan. Make sure to specifically ask for a "Body Composition DEXA scan." If you plan on tracking your progress over time, try negotiating a package deal for a few scans throughout the year. Many providers are happy to offer a discount if you prepay or commit to a bundle.
InBody
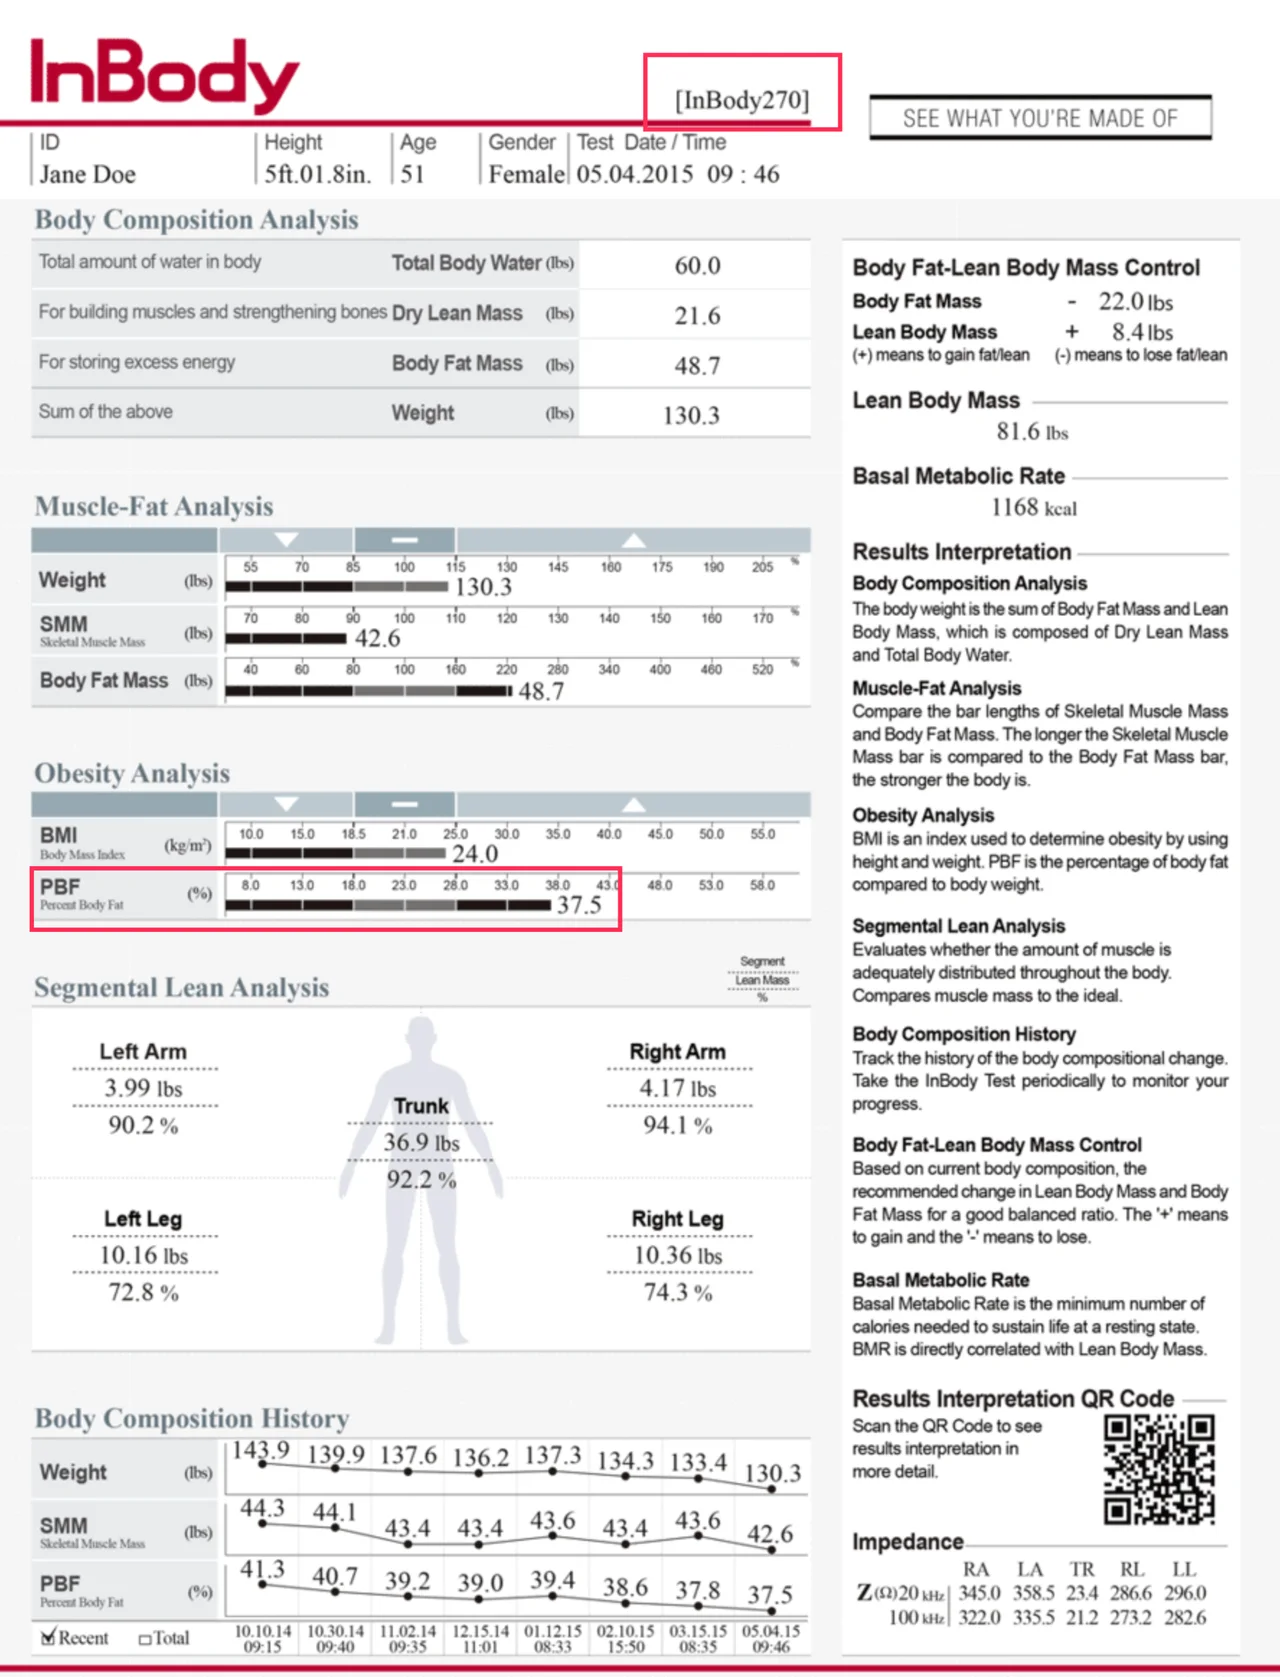
You've probably seen InBody machines at your local gym, as they've become incredibly common worldwide. The models you'll run into most often are the InBody 260 and 270. While these are perfectly fine for keeping an eye on overall trends (like whether your muscle or fat mass is generally going up or down), they aren't highly accurate. In fact, they aren't even close to the precision you get from a DEXA scan.
| Feature | InBody 260/270 | InBody 770 | InBody 970/970S |
|---|---|---|---|
| Frequencies | 2 (20, 100 kHz) | 6 (1, 5, 50, 250, 500, 1000 kHz) | 6 or 8 depending on model/region (up to 3 MHz) |
| Segmental analysis | ✓ | ✓ | ✓ |
| Intracellular vs extracellular water | Basic | Advanced | Most advanced |
| Phase angle | Limited | ✓ | Multi-frequency segmental phase angle |
| BIVA/Cole-Cole analysis | No | Limited | ✓ |
| Target users | Gyms | Sports medicine, clinics | Research, hospitals |
As you go up the product line, the accuracy gets better:
InBody 970/970S > InBody 770 > InBody 260/270
Yet, even the top-of-the-line InBody 970/970S falls short of a DEXA scan when it comes to pinpointing body composition. The high-end models do a much better job of minimizing errors and delivering deeper metrics, but as the table shows, they still can't match DEXA's gold standard accuracy. Since these professional machines cost thousands of dollars and still have limits, a cheap smart scale doesn't stand a chance. Save your money instead of wasting it on those home gadgets.
Accuracy of methods
For body fat % measurement, in terms of accuracy:
| Tier | Category | Methods | Notes |
|---|---|---|---|
| Tier 1 | Criterion & Reference Methods | MRI | Direct adipose tissue quantification, no assumptions |
| Tier 1 | Criterion & Reference Methods | 4-Compartment Models (4C) | Criterion gold standard for living subjects |
| Tier 1 | Criterion & Reference Methods | DEXA | 3-compartment model, high precision, clinical reference |
| Tier 2 | High-Quality Densitometry | Hydrostatic Weighing (UWW) | Classic 2-compartment density method |
| Tier 2 | High-Quality Densitometry | Bod Pod | Air displacement plethysmography, comparable to UWW |
| Tier 3 | Validated Field & Clinical Methods | Ultrasound (B-mode / A-mode) | Measures fat layer thickness; less operator-dependent than calipers |
| Tier 3 | Validated Field & Clinical Methods | Expert Skinfold Calipers | Highly dependent on technician skill; uses validated equations |
| Tier 3 | Validated Field & Clinical Methods | High-End Multi-Frequency Segmental BIA (e.g., InBody 970/770) | ≥6 frequencies, up to 1 MHz, 8-point electrodes |
| Tier 4 | Good Multi-Frequency BIA (Research/Clinical Grade) | Other MF-BIA devices (e.g., Seca mBCA, Tanita MC-780) | Reasonable accuracy; typical error ~3.5–5% vs DEXA (varies by population) |
| Tier 5 | Estimation & Basic Devices | US Navy Formula | Circumference-based; population averages; error typically >4–5% |
| Tier 5 | Estimation & Basic Devices | Single-Frequency BIA | Consumer devices; highly hydration-dependent; lowest electronic accuracy |
DEXA Limitations
A DEXA scan does not directly measure skeletal muscle tissue. Instead, it measures bone mineral content, fat mass, and lean soft tissue mass. Lean soft tissue is often used as a proxy for muscle because skeletal muscle is its largest component, but it also includes water, glycogen, organs, connective tissue, and other non-fat tissues.
Because of this, fat-free mass (FFM) and FFMI are sensitive to short-term changes in hydration and glycogen. If an individual drastically reduces carbohydrate intake for several days, glycogen depletion and associated water loss can reduce measured FFM by several kilograms without any meaningful loss of contractile muscle tissue. Changes in sodium intake, carbohydrate intake, and creatine supplementation can similarly alter fluid balance and influence measured FFMI.
DEXA also has limitations in separating specific tissue compartments. It cannot reliably distinguish small lipid deposits within muscle. Intramyocellular lipid (IMCL), which consists of fat droplets stored inside muscle cells, is generally not separately identified by DEXA and is included within the lean soft tissue compartment. Intermuscular adipose tissue (IMAT), located between muscle groups, may also be incompletely distinguished from surrounding lean tissue depending on its size and distribution. Therefore, changes in DEXA-derived lean mass do not always represent changes in actual skeletal muscle protein.
TL;DR: Do not interpret "loss of lean mass" from a DEXA scan as automatically equal to loss of muscle tissue. DEXA measures lean soft tissue, not skeletal muscle directly, and changes can reflect shifts in water, glycogen, and other non-muscle components.
Visual guide
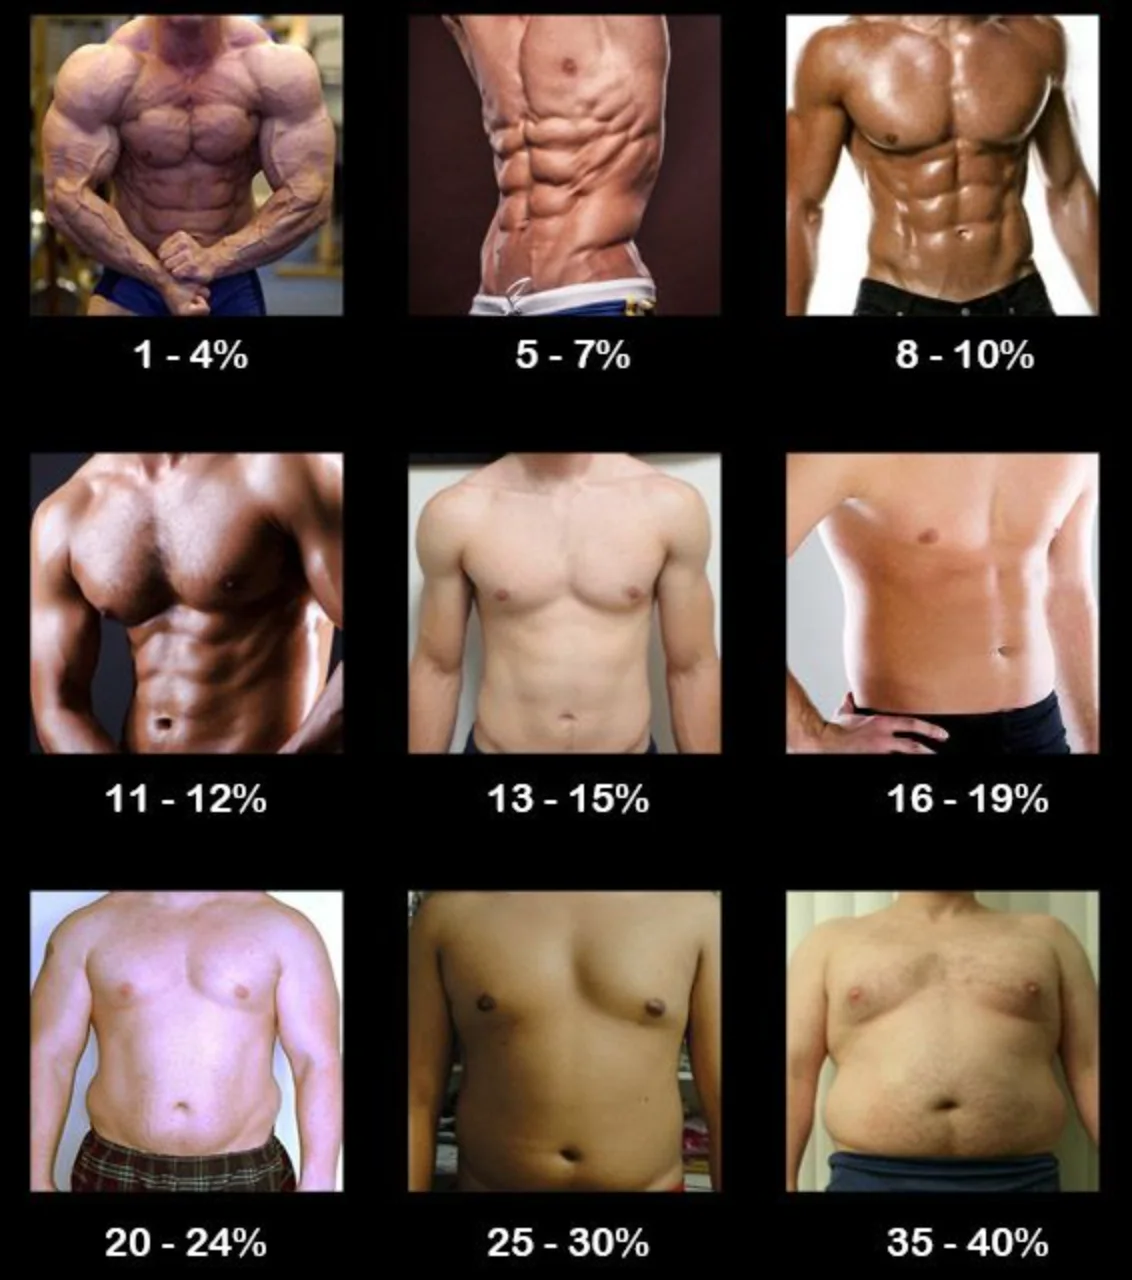
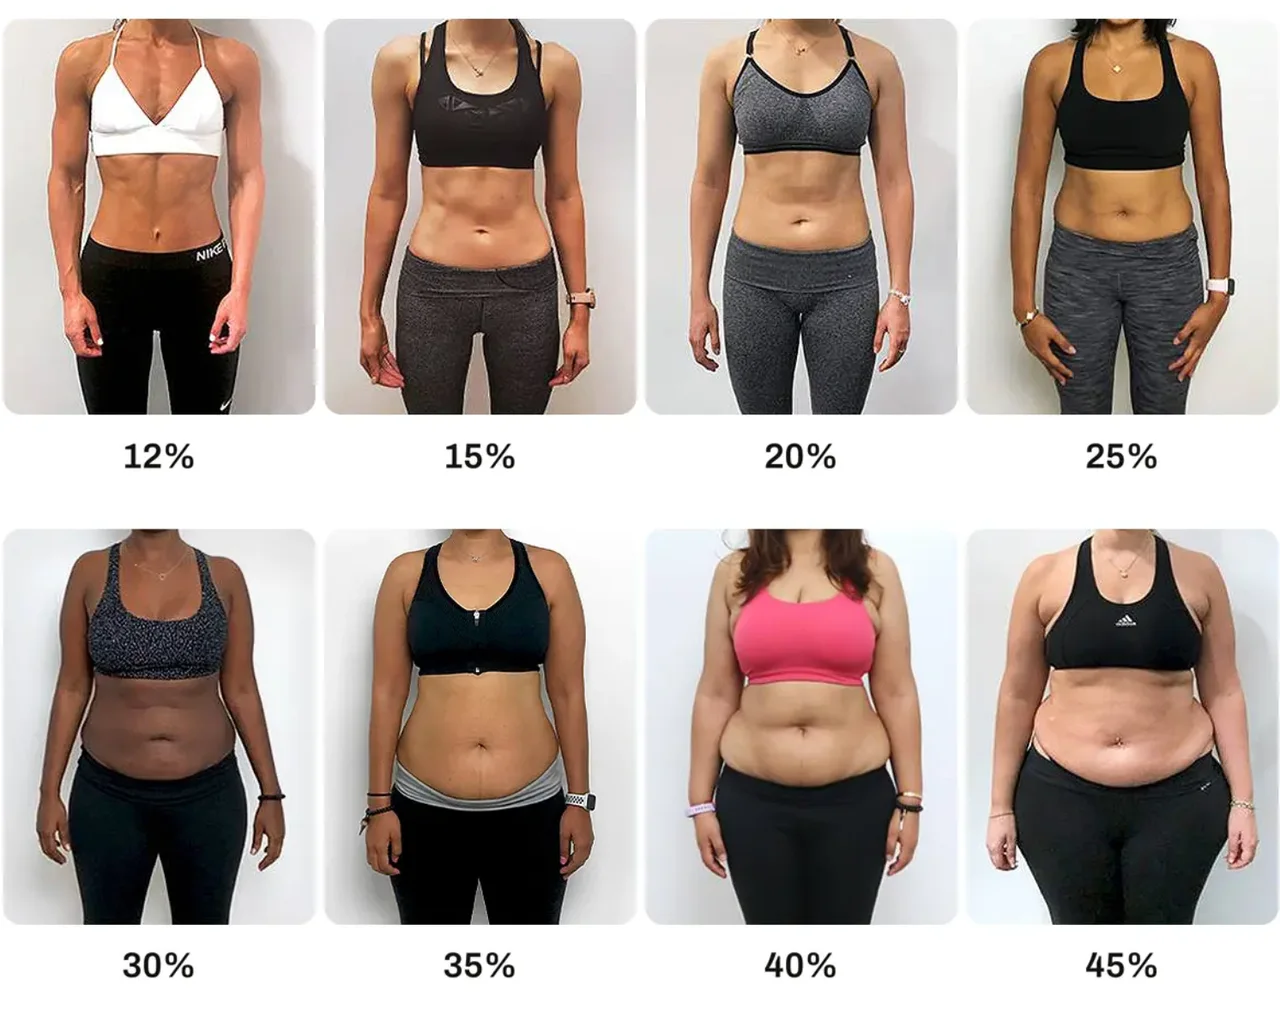
Visual estimates, even by professionals, are significantly less accurate than DEXA scans, no matter what some forum discussions might claim. That said, for contest or photoshoot preparation, visual assessments for conditioning are a practical method. In such cases, it's beneficial to seek guidance from a coach's trained eye for a more reliable evaluation.
Why are visual body fat comparisons so often misleading?
A few major factors explain why looking at photos rarely tells the whole story.
1. The same body fat percentage can look completely different, even at the exact same height
Body fat percentage only tells you the ratio of fat to your overall body weight. It does not reveal how much muscle you carry unless you factor in your scale weight to calculate your actual lean and fat mass.
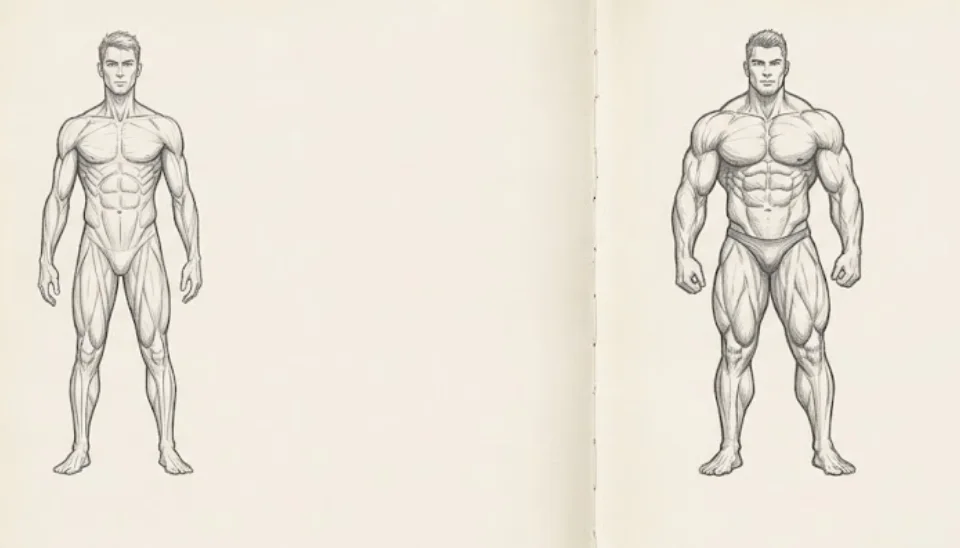
Take two men who are both 180 cm (5 ft 11 in) tall and sit at 10% body fat:
- One weighs 70 kg (154 lb)
- The other weighs 90 kg (198 lb)
Even with identical body fat percentages, their physiques will not look similar at all.
The 90 kg individual has significantly more lean mass, along with more absolute fat mass.
- The 90 kg person has 9 kg of fat and 81 kg of lean mass.
- The 70 kg person has 7 kg of fat and 63 kg of lean mass.
This means the heavier man has 2 kg more fat, but a massive 18 kg more lean mass. That extra muscle creates a larger, rounder, and much fuller shape. Because of this, the heavier man will usually look leaner and more defined, despite both individuals sitting at exactly 10% body fat.
With 18 kg of extra muscle, his biceps, quads, and lats have a much larger circumference. This gives him a naturally wider and more developed silhouette.
2. The "peaks and valleys" effect of body topography
Most people can guess body fat fairly well if the subject has decent muscle mass. However, those guesses get highly inaccurate when looking at someone with average or below-average muscle.
It sounds counterintuitive, but visual leanness depends heavily on your body's physical contours, not just how thick your fat layer is. The 90 kg lifter has prominent muscle peaks. When a bicep flexes and peaks, it stretches the skin and subcutaneous fat thin over the top. At the same time, the valleys between muscles (such as the gap separating the bicep and tricep) run deeper because the muscles on either side bulge outward. This casting of deep shadows and sharp transitions creates a highly defined look.
The 70 kg man has smaller muscle bellies. While he carries 2 kg less total fat, that fat is spread over a smaller frame. The skin does not stretch as tightly over his muscles, which leaves him with softer transitions and less defined separation.
This dynamic only holds true if both people are roughly the same height. It explains why a simple body fat percentage can never fully describe how someone actually looks.
Fitness influencers frequently exploit this topographic effect to look much larger on screen than they are in person.
You might wonder how someone of your exact height and weight looks so much bigger. The secret is usually a lower body fat percentage. A leaner build creates deeper shadows and sharper muscle separation, making muscles pop on camera.
If you saw that same influencer standing next to an average person, you would instantly see their true size. Often, they are not actually massive; they are just incredibly lean, and the lens exaggerates their shape.
This also explains why heavy strongmen or powerlifters can look surprisingly lean, sometimes even showing visible abs, at higher body fat percentages. Their massive amount of lean muscle mass carries the weight differently.
This does not mean tracking body fat is useless. If you know someone's height, weight, and body fat percentage, you can get a very solid mental picture of their build.
3. Fat distribution is highly individual
When we try to guess body fat, we usually focus on obvious areas like the shoulders, arms, chest, waist, and abs. We look at the core and the limbs because those are the areas on display.
But fat does not accumulate evenly. One person might store fat primarily in their thighs, hips, glutes, or lower back, while another stores it mostly around their stomach.
A DEXA scan measures fat distribution across your entire body to find your true overall percentage. Visual guesses, on the other hand, rely on just a few visible areas. Since everyone stores fat differently, two people with identical body fat levels can look entirely different.
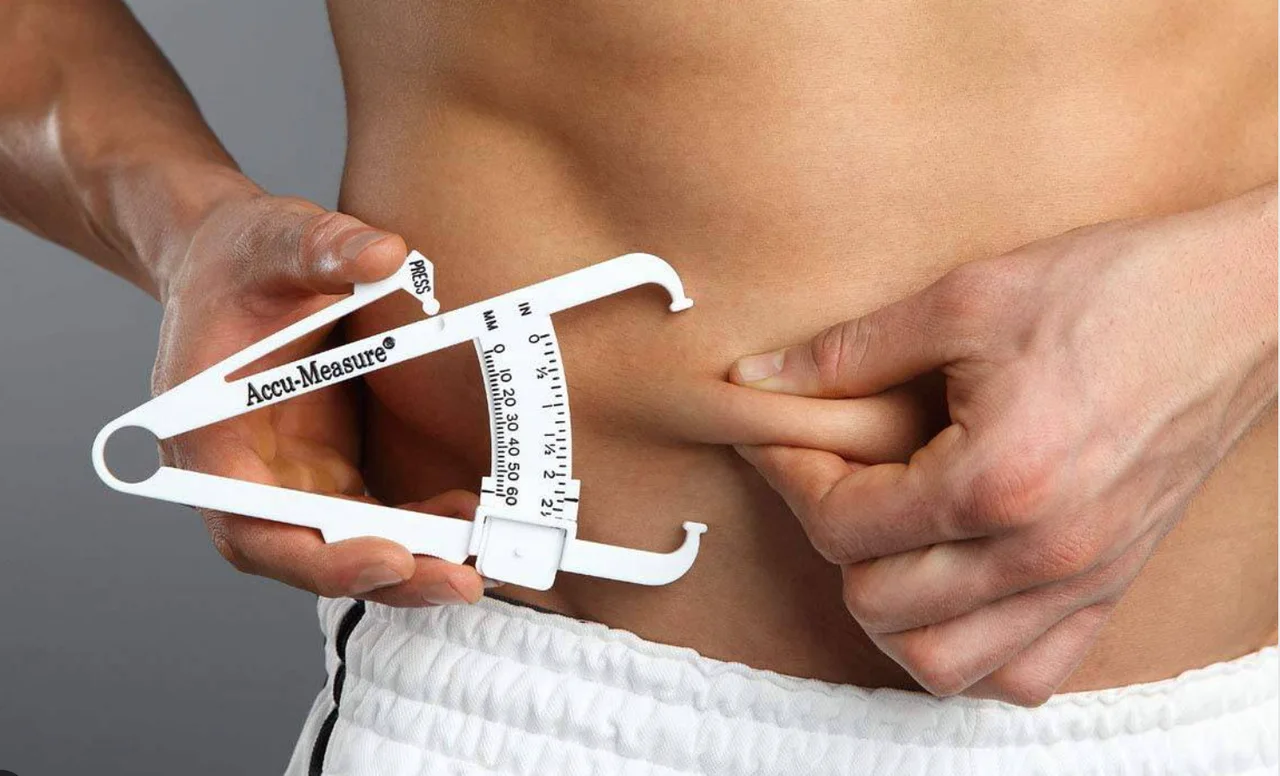
Coaches frequently rely on calipers or DEXA scans to track progress, but when bodybuilders step on stage, they are judged strictly on visual conditioning. Precise body fat percentages simply do not enter the equation. Many trainers love to say the eyes are the ultimate judge, but human vision still cannot match the precision of an MRI or a DEXA scan.
Long before these high-tech tools became common, lifters used a much simpler rule of thumb: bulk until your abs fade, then cut until they show up again. You do not need cutting-edge technology to get results.
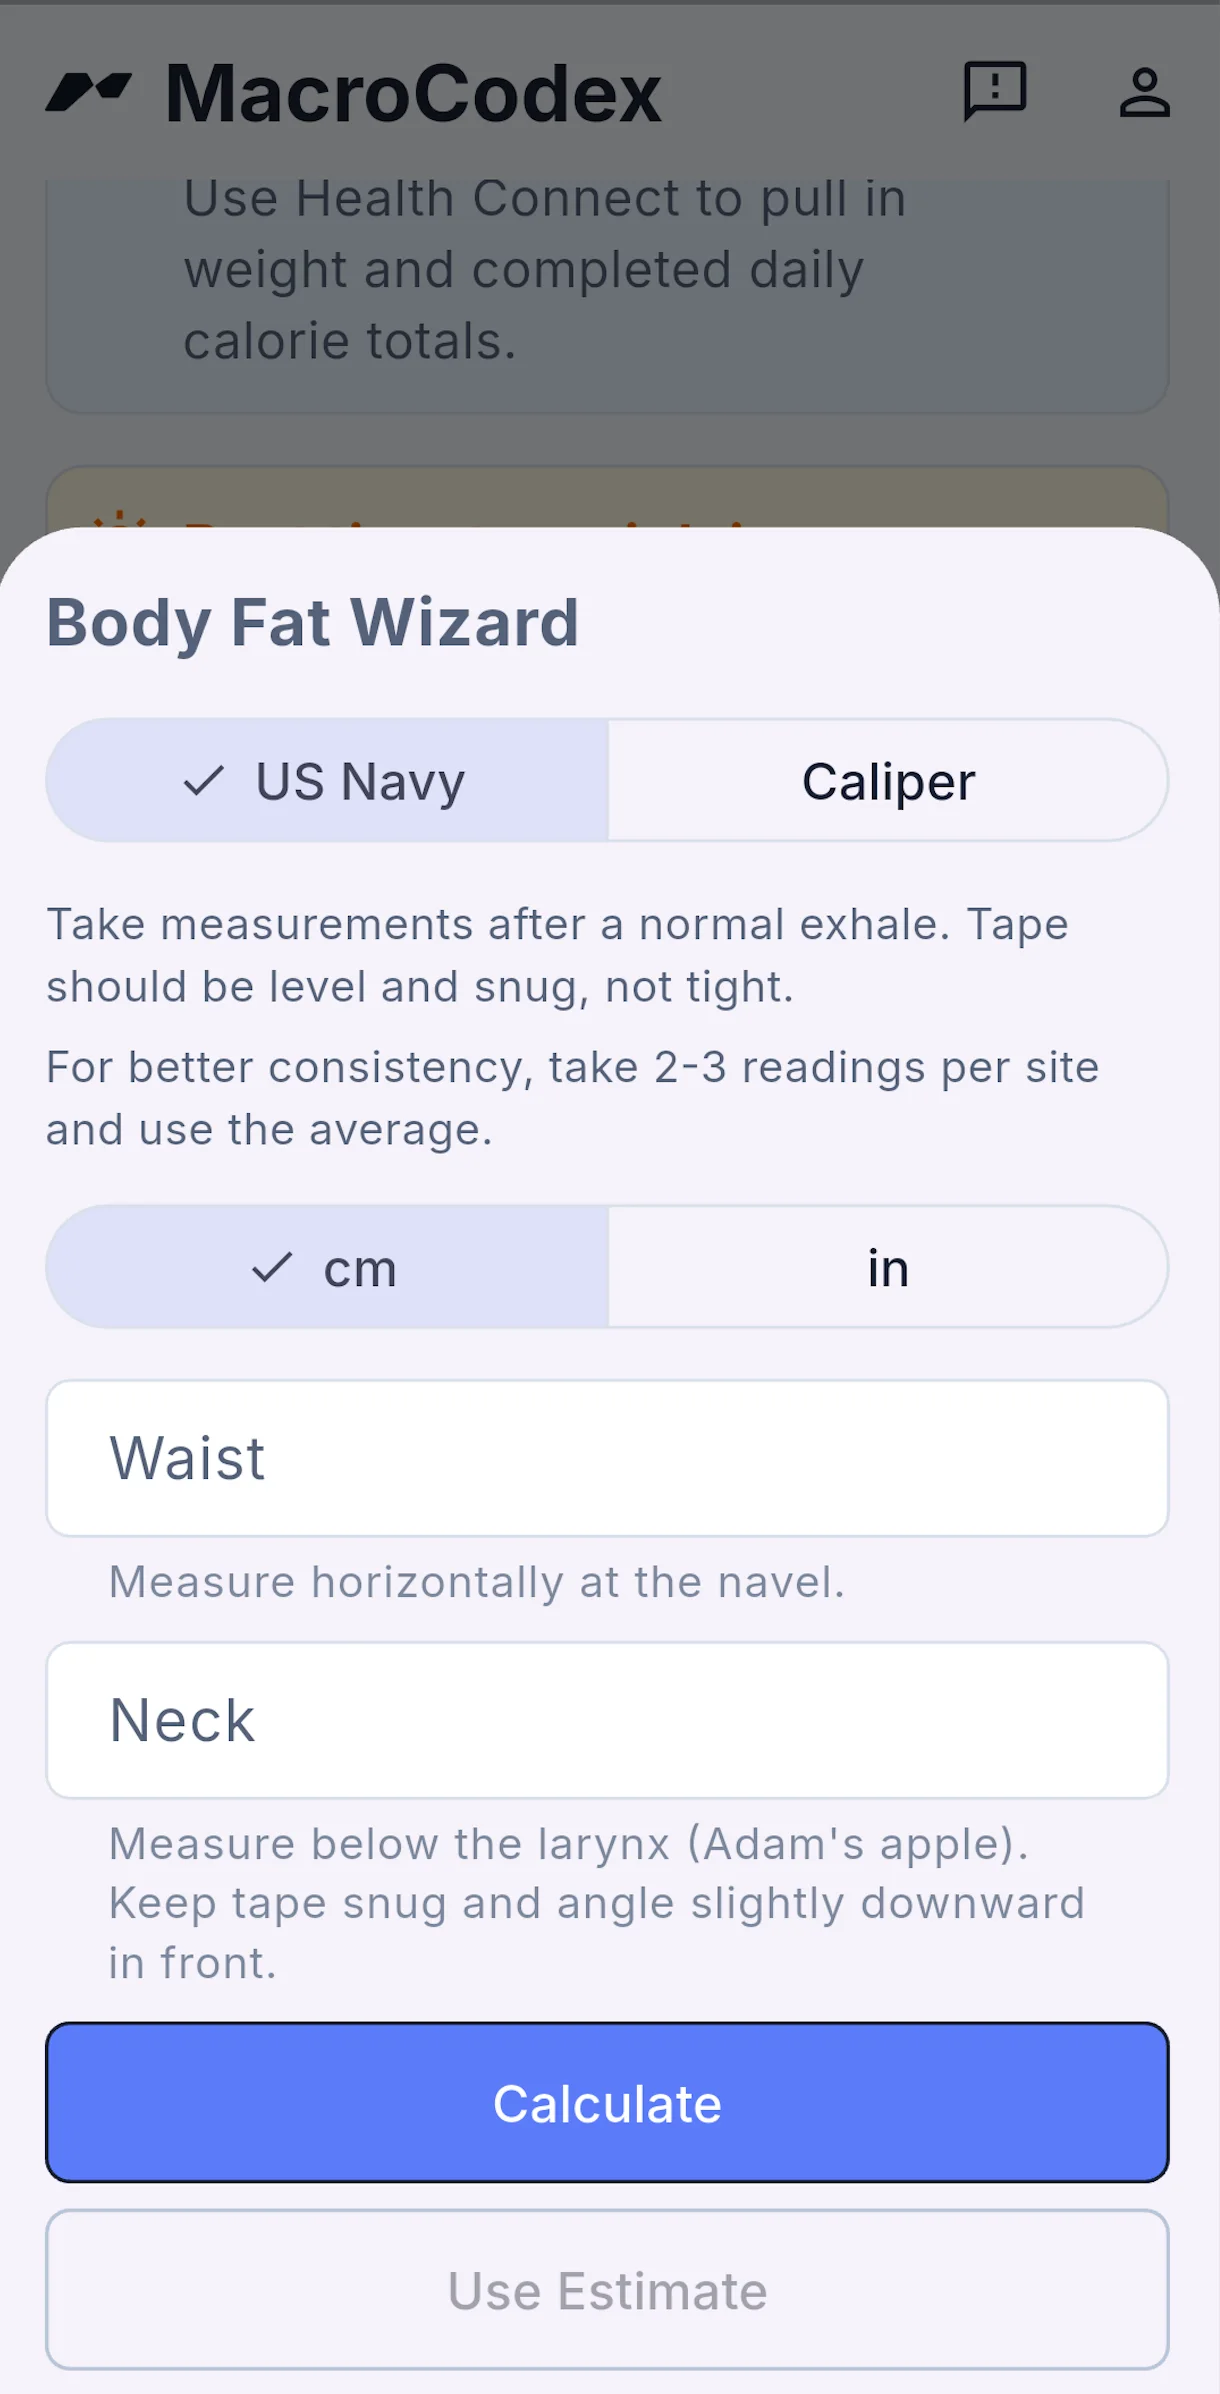
If you cannot get a DEXA scan, the free MacroCodex app has a built-in US Navy body fat calculator. The classic formula it uses is more than enough to establish a solid baseline.
| Category | Male Body Fat % | Female Body Fat % |
|---|---|---|
| Essential Fat | 2–5% | 10–13% |
| Athletic | 6–13% | 14–20% |
| Fitness | 14–17% | 21–24% |
| Average | 18–24% | 25–31% |
| Obese | 25%+ | 32%+ |
Table source: American Council on Exercise (ACE). ACE Personal Trainer Manual (multiple editions), based on body fat classification ranges derived from: Heyward, V. H. Advanced Fitness Assessment and Exercise Prescription. Human Kinetics.
To translate male body fat targets to female equivalents, you can generally just add 9 to 10 percentage points.
Here is how that looks in practice:
- If the recommendation for a man is to cut to 10-12%, the target for a woman is about 19-21%.
- If a man is advised to bulk up to 17%, the equivalent target for a woman is roughly 26-27%.
This quick adjustment makes it easy to convert standard fitness guidelines between genders.
Is 10% body fat too low for a male, or 19% too low for a female?
Not necessarily.
For reference:
The minimum safe levels generally recommended for health are:
Dropping significantly below these markers increases the risk of hormonal imbalances, metabolic slowdown, poor recovery, and compromised bone health.
It is also crucial to distinguish between two very different scenarios:
- Briefly reaching a low body fat level at the end of a diet
- Trying to maintain that same level year-round
For instance, hitting 10% body fat temporarily at the tail end of a cut before transitioning back to a lean bulk is completely different from staying at 10% indefinitely. Keeping your body fat that low year-round demands strict lifestyle control, meticulous recovery, precise dietary adherence, and highly favorable genetics.
Of course, some people (especially highly active individuals and athletes) feel perfectly fine maintaining around 8% body fat year-round. Individual tolerance varies immensely based on your genetics, activity level, stress, sleep quality, caloric intake, and overall clinical health markers.
Ultimately, you should aim for a body fat percentage that is sustainable, healthy, and realistic for your long-term lifestyle.
What bodyfat% should i cut or lean bulk to?
| Category | Male Body Fat % | Female Body Fat % |
|---|---|---|
| Essential Fat | 2–5% | 10–13% |
| Athletic | 6–13% | 14–20% |
| Fitness | 14–17% | 21–24% |
| Average | 18–24% | 25–31% |
| Obese | 25%+ | 32%+ |
Table source: American Council on Exercise (ACE). ACE Personal Trainer Manual (multiple editions), based on body fat classification ranges derived from: Heyward, V. H. Advanced Fitness Assessment and Exercise Prescription. Human Kinetics.
For natural bodybuilders, a reliable rule of thumb is to cut down to 10% body fat and bulk up to 17% for men (roughly 19% to 26% for women). This strategy maximizes muscle growth while minimizing excess fat gain, keeping you relatively lean so you never actually look or feel out of shape.
With every successful bulk-and-cut cycle, you gradually accumulate more muscle tissue. Most people need to repeat this process several times to reach their ultimate physique goals.
Historically, lifters would bulk until their abs completely vanished, then cut until they were highly defined without dropping so low that they ruined their hormones or suffered from low energy. Over time, people realized this sweet spot aligns with roughly a 10% to 17% range for men and a 19% to 26% range for women. Staying within these bounds keeps you a stone's throw from a lean, defined look.
This approach is designed for individuals with a BMI around 21 or higher who want to build significant muscle while maintaining an aesthetic look. It does not apply to athletes like sumo wrestlers, powerlifters, or strongmen, who prioritize sheer strength over lean aesthetics.
This is not a rigid rule. While some people bulk up to 20%, others argue that pushing past 17% (or 26% for women) is counterproductive since you begin to look visibly soft. That said, if you perform exceptionally well at 8% body fat, there is no reason you cannot cut to that level.
Keep in mind that this rule does not apply if you are underweight or currently skinny-fat. The reasoning for this is explained in detail in the Skinny Fat Guide.
For individuals starting with a high body fat percentage, a solid approach is to cut down to around 20% first, then transition into a body recomp. Attempting to recomp from a very high body fat percentage can be frustratingly slow, often leading people to give up when they do not see visual changes for months.
If your goal is not to maximize muscle but simply to look lean and fit, a simpler approach works well. For example, an office worker who is not significantly overweight (defined here as having an overweight BMI and a body fat percentage above 25%) can aim for roughly 15% body fat for men or 23% to 24% for women. You can also use the visual reference above to target a look you like.
In coaching, we use these generalized guidelines because they deliver excellent results for the vast majority of people. As you gain experience and understand the logic behind these ranges, you can adapt and break these rules to better fit your personal needs.
When will abs appear? When will belly fat, face fat, love handles disappear?
Here are some general benchmarks for when your abs and leaner features should start showing:
- Men: Abs generally become visible between 10% and 15% body fat, with sharp definition appearing below 9%. You will likely notice your face leaning out around 13% to 14%.
- Women: Abs typically show up between 16% and 20% body fat, while the face begins to slim down around 18% to 22%.
Individual fat distribution is heavily dictated by genetics. In coaching, we usually advise clients to cut to 10% to 12% for men and 19% to 22% for women (or lower if they want distinct definition). Unless you possess the massive lean muscle mass of an elite strongman like Eddie Hall, you are unlikely to see highly defined abs at higher body fat percentages. While some rare individuals who do not store fat in their midsection might see their abs at higher body fat levels, the standard coaching recommendation is to get leaner and verify your progress with a DEXA scan.
If you are not seeing the definition you want yet, focus on continuing your cut rather than blaming genetics too early.
Most importantly, you need to train your abs just like any other muscle group. Developing those muscles makes them larger, meaning they will pop and show through at slightly higher body fat percentages.
While you cannot spot-reduce belly fat with targeted abdominal exercises, training your abs directly builds their size, making them far more visible once you reach a lower body fat percentage.