How many calories do you burn in a day? Apple Watch and Garmin are wrong!
Your watch gives you a calorie-burn number. An online calculator gives you another. How do you find out whether either estimate fits you?
The answer starts with something you can observe over time: how much you eat, and what happens to your weight.
What about Apple Watch, Garmin, and fitness bands?
A watch can count your steps and measure your heart rate reasonably well without knowing exactly how much energy you burn.
Smartwatches are notorious for inaccurate calorie-burn estimates. A 2020 systematic review by Fuller et al. showed that consumer wearables perform poorly at calculating energy expenditure, even if they count steps and measure heart rate reasonably well [4]. Devices from major brands like Apple, Garmin, Polar, and Withings frequently showed significant errors, typically ranging from 15% to 40%, and sometimes climbing past 50% [4]. While wearables are decent for monitoring general trends, you should not rely on them for precise calorie targets.
There is another way to estimate your maintenance calories: track your calorie intake against your body weight trend. It does not require you to wear a sensor.
What are maintenance calories (TDEE)?
TDEE (Total Daily Energy Expenditure) represents the total amount of energy your body burns over a 24 hour period.
It covers everything from physical activities like lifting weights, running, and daily steps, to involuntary processes like breathing, digestion, and muscle protein synthesis.
We measure this energy in calories (often written as kcal or cal). In nutrition, these terms are used interchangeably.
When you consume more energy than your body burns, the excess is stored as fat to serve as a backup energy reserve.
TDEE also goes by several other names:
- Maintenance Calories
- Maintenance Intake
- Maintenance Energy Needs
These terms all mean the exact same thing.
For example, if you are an 80 kg (176 lbs) man with a daily maintenance level of 2,700 kcal, eating an average of 2,700 kcal per day should keep your weight trend roughly stable over several weeks.
A very common mistake among beginners is confusing BMR with overall maintenance calories. BMR is actually just one component of your TDEE.
-
Basal Metabolic Rate (BMR): The baseline energy required to keep you alive at rest. This fuels essential tasks like breathing, circulating blood, regulating body temperature, brain function, and cell maintenance. Even if you stayed in bed all day, this would still make up the largest share of your daily burn.
-
Thermic Effect of Food (TEF): The energy used to digest, absorb, and process the nutrients you eat. Different macronutrients require different amounts of work to process. Protein has the highest thermic effect, followed by carbohydrates, and then fats. Eating itself actually increases your energy expenditure slightly.
-
Exercise Activity Thermogenesis (EAT): The calories burned during planned workouts, such as weightlifting, running, cycling, sports, or structured cardio sessions. This component varies the most from person to person and shifts dramatically depending on how often and how hard you train.
-
Non-Exercise Activity Thermogenesis (NEAT): Every movement you make outside of formal workouts. This includes walking around the house, standing at your desk, fidgeting, maintaining your posture, typing, and doing chores. For active individuals, NEAT often contributes far more to daily calorie burn than structured workouts.
Your maintenance calories (TDEE) are not a static, permanent number. They shift constantly, even when your weight, height, muscle mass, and activity levels appear to be completely unchanged.
TDEE Calculators and ChatGPT
Standard online calculators estimate your TDEE using basic inputs like age, height, weight, and activity level. Since they do not ask if you have underlying metabolic or health issues like PCOS or thyroid conditions, they cannot account for the natural differences in metabolic rate between people with the same basic stats.
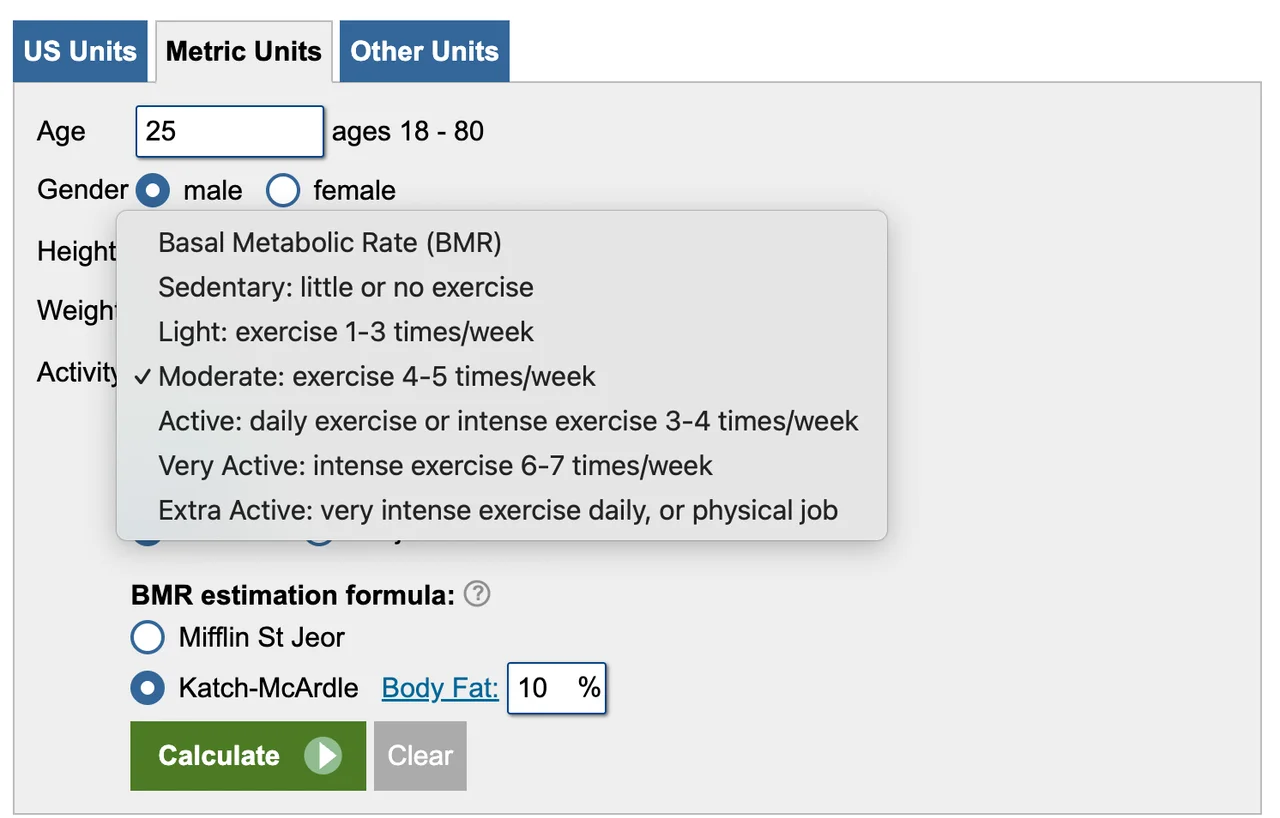
The way these calculators classify activity is also incredibly vague. Labels like "sedentary," "lightly active," or "very active" do not mean much in practice. A person on their feet doing physical labor for ten hours a day might get lumped into the same category as an office worker who exercises for an hour. To make matters worse, these tools use rigid multipliers on your BMR, assuming a neat, predictable energy increase that rarely matches reality.
If you need to choose one of those labels, see our TDEE calculator activity-level guide for common factors and a way to check your starting choice.
If you ask ChatGPT for your maintenance calories, it will readily give you a number. If you ask how it got that number, it will explain that it ran a formula like Katch-McArdle, Harris-Benedict, or Mifflin-St Jeor, and then applied an activity factor. These formulas are built on statistical regressions from historical population averages [2]. Consequently, the resulting estimate can easily be off by hundreds of calories. The same starting-estimate limitation applies to Calculator.net and TDEECalculator.net; those guides explain each site's method and how to check its result.
Some basic calculators omit body fat percentage, though Calculator.net and TDEECalculator.net both offer an optional input for it. Weight is not uniform. A 2010 study by Wang et al. in the American Journal of Clinical Nutrition showed that 10 kg of muscle burns roughly 100 to 130 kcal per day at rest, whereas 10 kg of fat burns only about 14 to 20 kcal [1]. A formula based on weight alone can miss differences in body composition, and an optional body-fat estimate still does not measure a person's actual TDEE.
These calculators account for daily movement only through a broad activity choice; they do not directly measure NEAT. A 2005 study in Science by Levine et al. demonstrated that NEAT can account for a difference of hundreds of calories burned daily, which is difficult to capture with one activity label [2].
Even if you could account for all these variables, individual metabolic differences still get in the way. Research by Zurlo et al. published in the 1990 American Journal of Physiology found that even when two people have the exact same weight and body composition, their resting energy expenditure can vary by 10% to 15% due to genetics, hormones, and lifestyle factors [3].
A calculator gives you a starting estimate. Your weight trend helps you check whether that estimate fits you.
A calculator estimate versus three weeks of logs
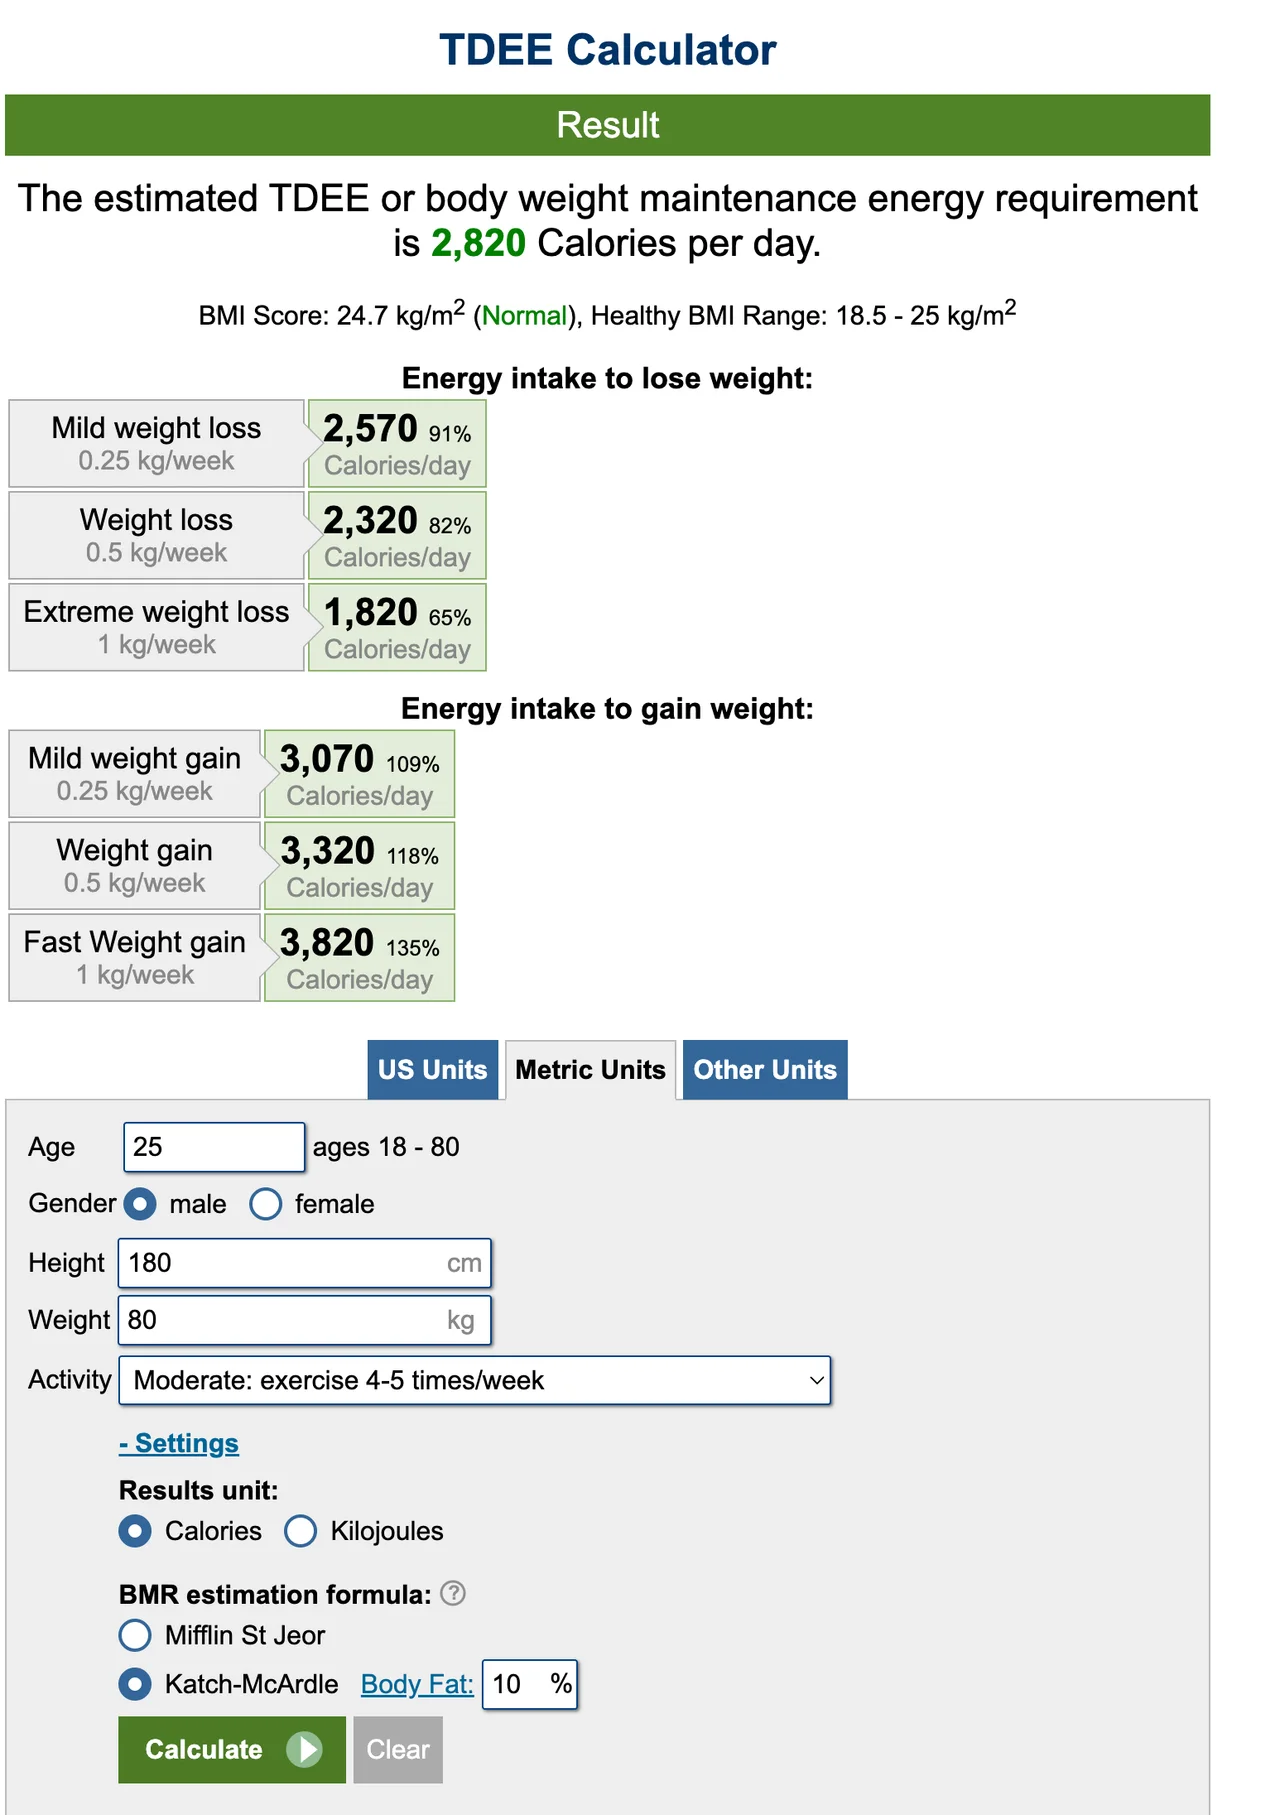
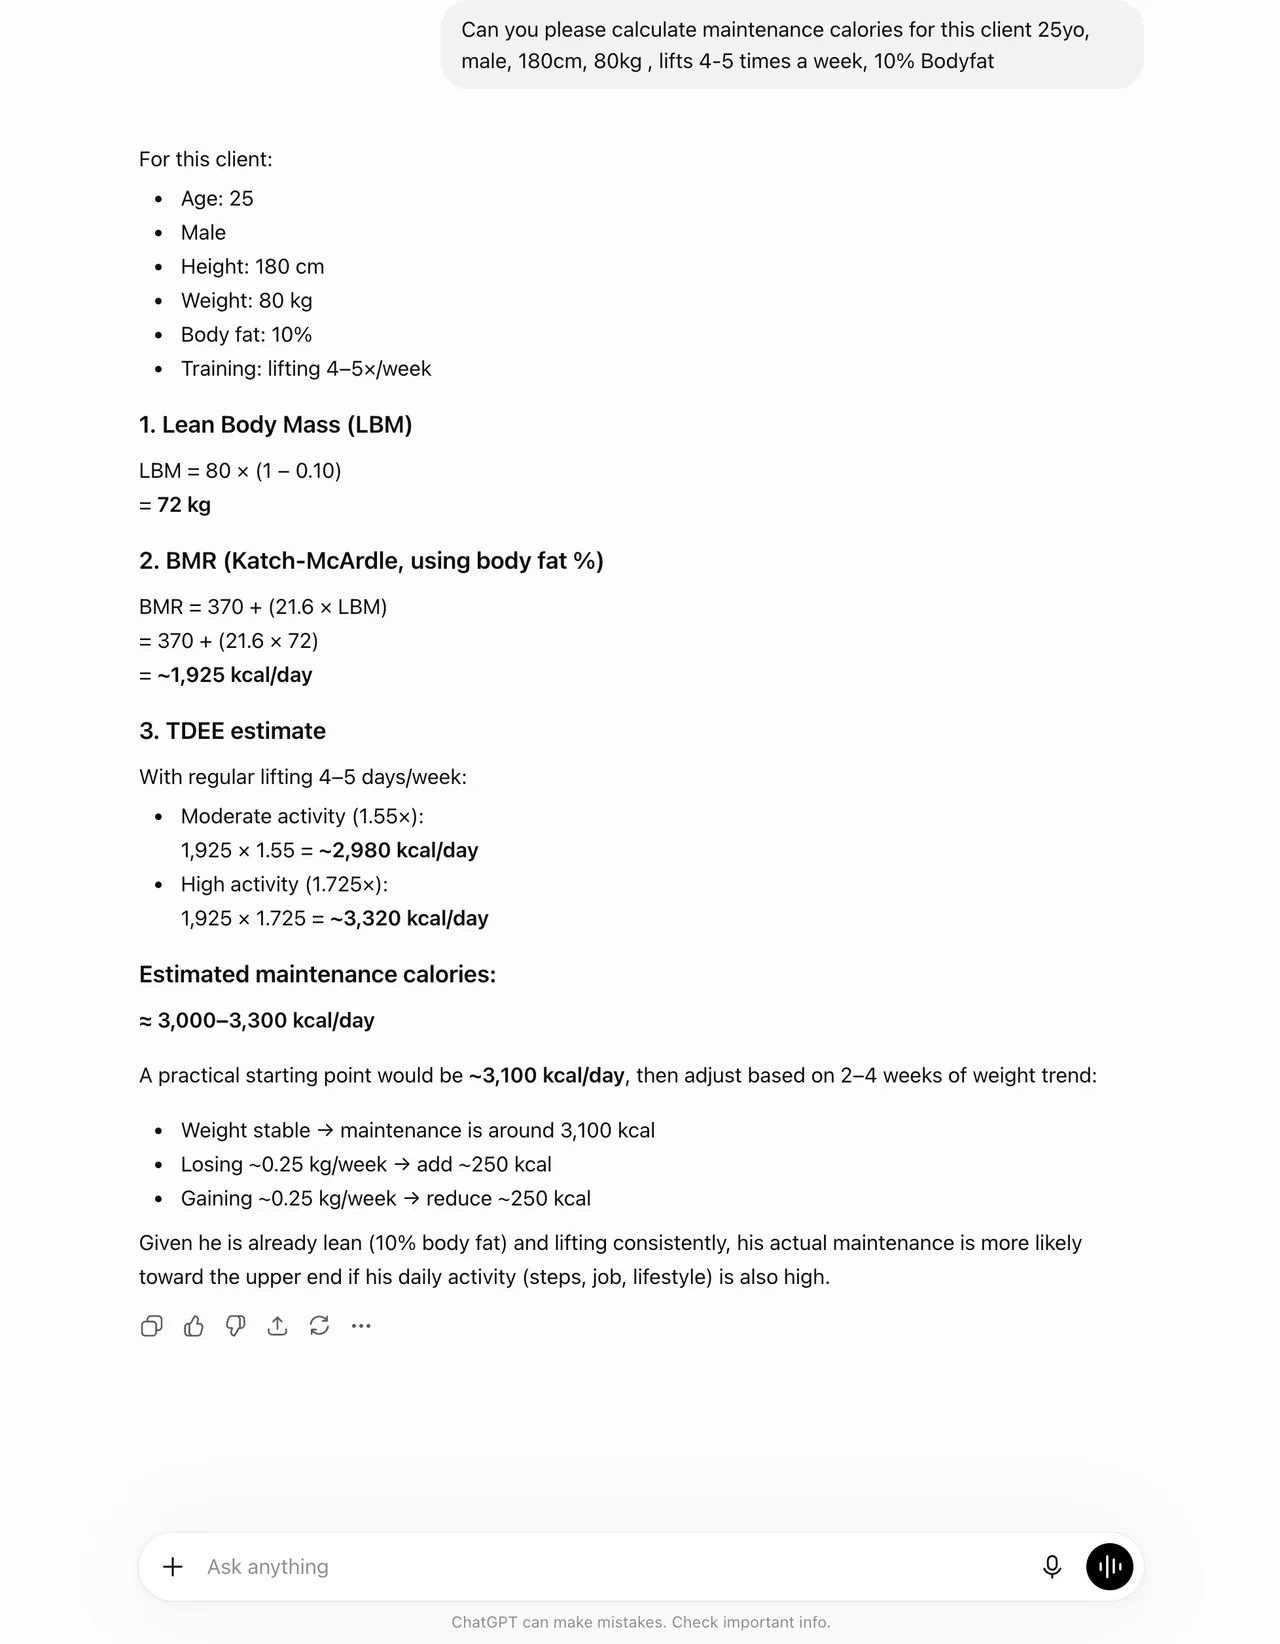
Let's look at a real-world example. One client had his maintenance calories estimated at 2,820 kcal per day by online calculators, even after inputting his body fat percentage from a DEXA scan. ChatGPT estimated his maintenance at 2,980 kcal. However, after tracking his actual food intake and daily weight for three weeks, his maintenance estimate based on those logs was 2,410 kcal per day. This client has no metabolic health conditions. This is one client’s example, not a benchmark for every calculator user.
Use the relationship in reverse
The core concept is straightforward:
- Eat fewer calories than your body burns, and you lose weight (a deficit).
- Eat more calories than your body burns, and you gain weight (a surplus).
- Eat the exact amount your body burns, and your weight stays the same (maintenance).
We can use this basic relationship to estimate your maintenance calories. This estimate reflects your workouts, daily steps, and overall lifestyle, since all of those elements directly shape your weight and intake data.
Estimate your TDEE from food intake and weight
Let's look at the manual calculation first, followed by a simpler automated alternative.
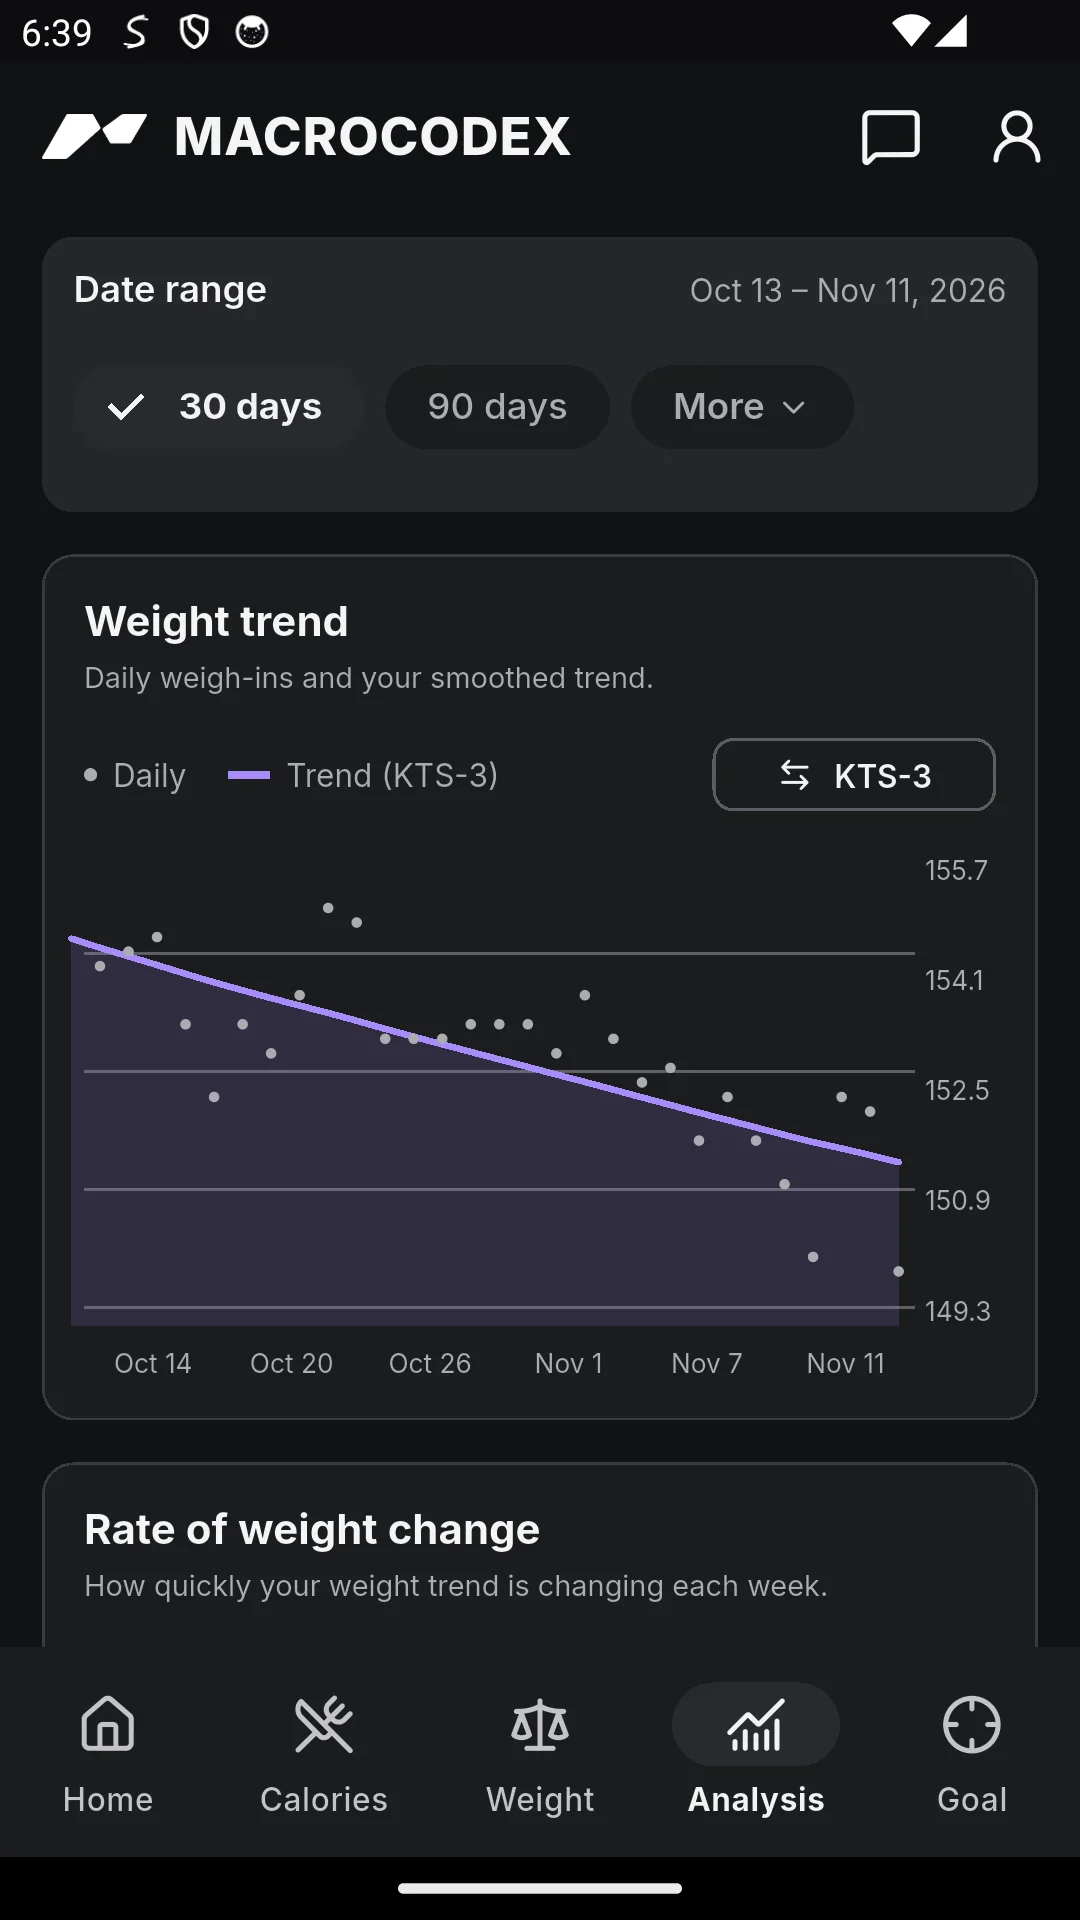
Track your daily food intake and body weight for three to four weeks. Using a longer timeframe helps smooth out daily weight fluctuations caused by water retention, glycogen storage, sodium intake, and digestion.
At the end of this period, determine:
- Your average daily calorie intake.
- Your average weekly weight change.
For a rough calculation, use these approximations:
These are useful rules of thumb, not fixed conversion factors for every change on the scale. Water, glycogen, and changes in body composition can affect the result. The calculation estimates average expenditure over the tracking period, rather than measuring each day’s burn.
If your weight went up:
TDEE = Average Intake − Daily Surplus
If your weight went down:
TDEE = Average Intake + Daily Deficit
Example 1 (Weight Gain in lbs)
- Average weight gain: 1 lb/week
- Average calorie intake: 4,000 kcal/day
Step 1
Since 1 lb is roughly 3,500 kcal, you accumulated a 3,500 kcal surplus for the week.
Step 2
3,500 ÷ 7 = 500 kcal surplus per day
Step 3
TDEE = 4,000 − 500 = 3,500 kcal/day
Example 2 (Weight Gain in kg)
- Average weight gain: 0.5 kg/week
- Average calorie intake: 3,000 kcal/day
Step 1
0.5 × 7,700 = 3,850 kcal surplus per week
Step 2
3,850 ÷ 7 = 550 kcal surplus per day
Step 3
TDEE = 3,000 − 550 = 2,450 kcal/day
Example 3 (Weight Loss in lbs)
- Average weight loss: 1 lb/week
- Average calorie intake: 2,000 kcal/day
Step 1
A loss of 1 lb per week translates to a daily deficit of 500 kcal per day
Step 2
TDEE = 2,000 + 500 = 2,500 kcal/day
Example 4 (Weight Loss in kg)
- Average weight loss: 0.5 kg/week
- Average calorie intake: 1,900 kcal/day
Step 1
0.5 × 7,700 = 3,850 kcal deficit per week
Step 2
3,850 ÷ 7 = 550 kcal deficit per day
Step 3
TDEE = 1,900 + 550 = 2,450 kcal/day
Important Notes
- Your TDEE is a moving target. It changes as your body weight shifts, your activity levels fluctuate, metabolic adaptation occurs, or your body composition changes.
- It is a good idea to recalculate every few weeks.
- Daily weight fluctuations are completely normal. Focus on the overall trend rather than individual daily weigh-ins.
- Incomplete food logs can bias the result. The estimate is only as useful as the intake and weight data behind it.
Your maintenance calories can shift even if your activity level, body weight, and body composition seem to stay exactly the same.
This idea predates fitness apps: The Hacker’s Diet
John Walker co-founded Autodesk in 1982. He was the company's first president and later continued serving as its chairman after handing over the presidency. His own account documents both the company's incorporation and first officers and his later departure as chairman.
While working at Autodesk, Walker wrote The Hacker's Diet, first published in 1991. Its computer tools were originally Microsoft Excel spreadsheets and macros, with weight-trend tracking and energy-balance calculations. The edition history and Walker's online tracker introduction document those origins.
Walker later released updated Excel versions, a Palm version called “Eat Watch,” and a free, web-based online tracker. These computer tools are freely available from Fourmilab, including public-domain source code for the online tracker.
By September 25, 2002, another person documenting their implementation at nuwen.net was using Excel to track daily weight, trend weight, calories consumed, and calories burned, implementing formulas from Walker's book. This was a separate implementation, not a spreadsheet developed by Walker in 2002.
You can do this with a spreadsheet
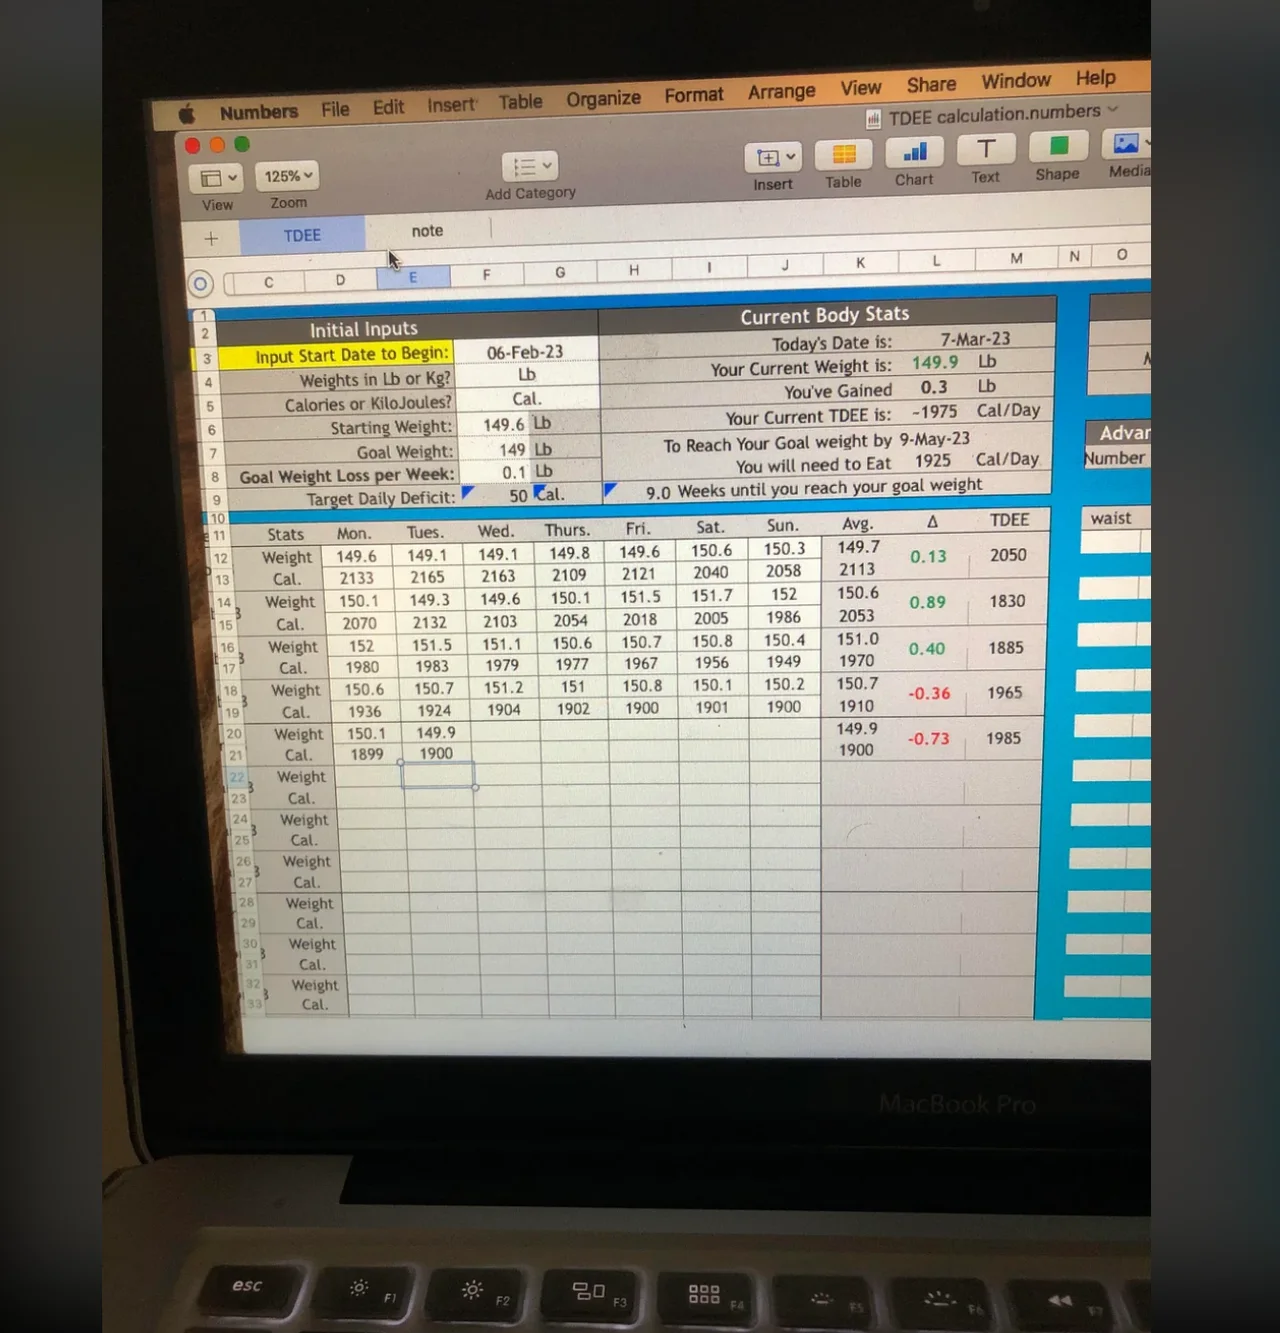
If you prefer a spreadsheet, you can enter your calorie intake and body weight and review how the estimated maintenance level changes over several weeks. Community-made adaptive spreadsheets were shared before dedicated apps became common. These are third-party resources that MacroCodex does not maintain:
These spreadsheets evaluated maintenance calories based on your personal weight and calorie intake instead of generic multipliers. They let you try the method without a dedicated app.
Because your maintenance calories shift over time, you have to recalculate them regularly. That is the work an adaptive TDEE tool automates.
Automating the tracking with MacroCodex
MacroCodex is our app for handling this work. It calculates your shifting TDEE in the background, so you only have to log your food and weight.
Simply log:
- Daily calorie intake
- Daily (or frequent) body weight
After about three weeks of consistent data, the app can estimate your maintenance calories and generate target numbers for your weight goals. Continue logging so the estimate can respond as your weight and activity change. It is still an estimate, with the same dependence on input quality described above.
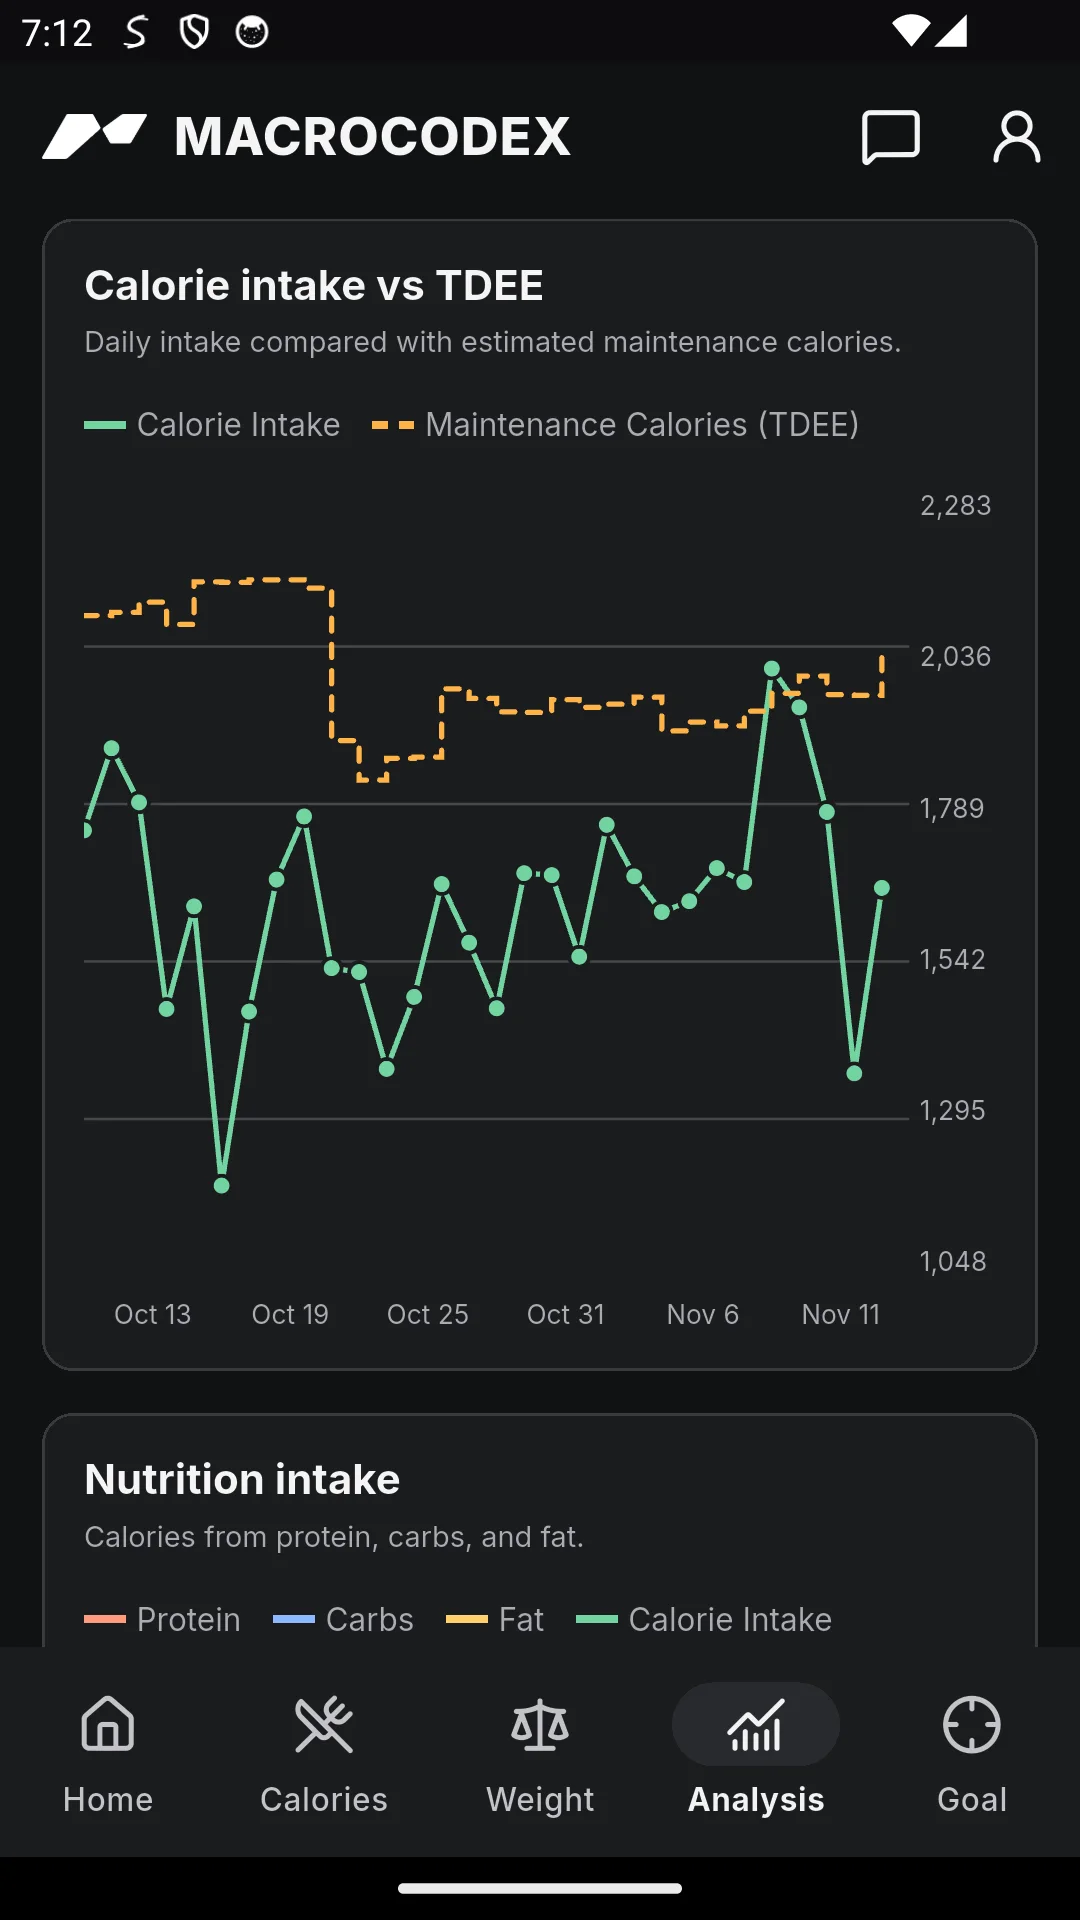
The dashed line on the chart shows your estimated maintenance calories (TDEE). If you want to lose weight, eat below this dashed line. If you want to gain weight, eat above it.
Curious how MacroCodex turns those everyday logs into a changing, personalized maintenance-calorie estimate? See Smart Calorie Burn v2, the algorithm that powers MacroCodex. It uses your intake and weight history to refine the estimate as new data comes in.
How do you know whether the estimate is accurate?
Imagine a car manufacturer claims that a new engine uses advanced space technology to improve fuel efficiency.
You do not necessarily need to understand the engineering inside the engine to test the claim. You can put a known amount of fuel into the vehicle, drive it, and measure how far it travels. If the vehicle consistently travels substantially farther on the same amount of fuel, then the improvement is measurable regardless of how complicated the internal technology is.
Smart Calorie Burn can be evaluated in the same way. The Smart Calorie Burn article develops this analogy: compare the prescribed rate of weight change with the observed rate over several weeks.
If the maintenance estimate fits you, eating around that amount should keep your weight trend roughly stable. Eating a known amount above or below it should produce a corresponding upward or downward trend. That is a testable prediction.
Here are selected MacroCodex user records for all three goals. Each table row is a week. Read the actual intake alongside the target: users do not always eat exactly what the app prescribes.
Lean bulk: a small surplus, measured over nine weeks
Lean bulking is hardest when your maintenance calorie estimate is inaccurate. The surplus you need is often very small, so even a modest error can turn your intended surplus into a deficit or an unnecessarily large surplus.
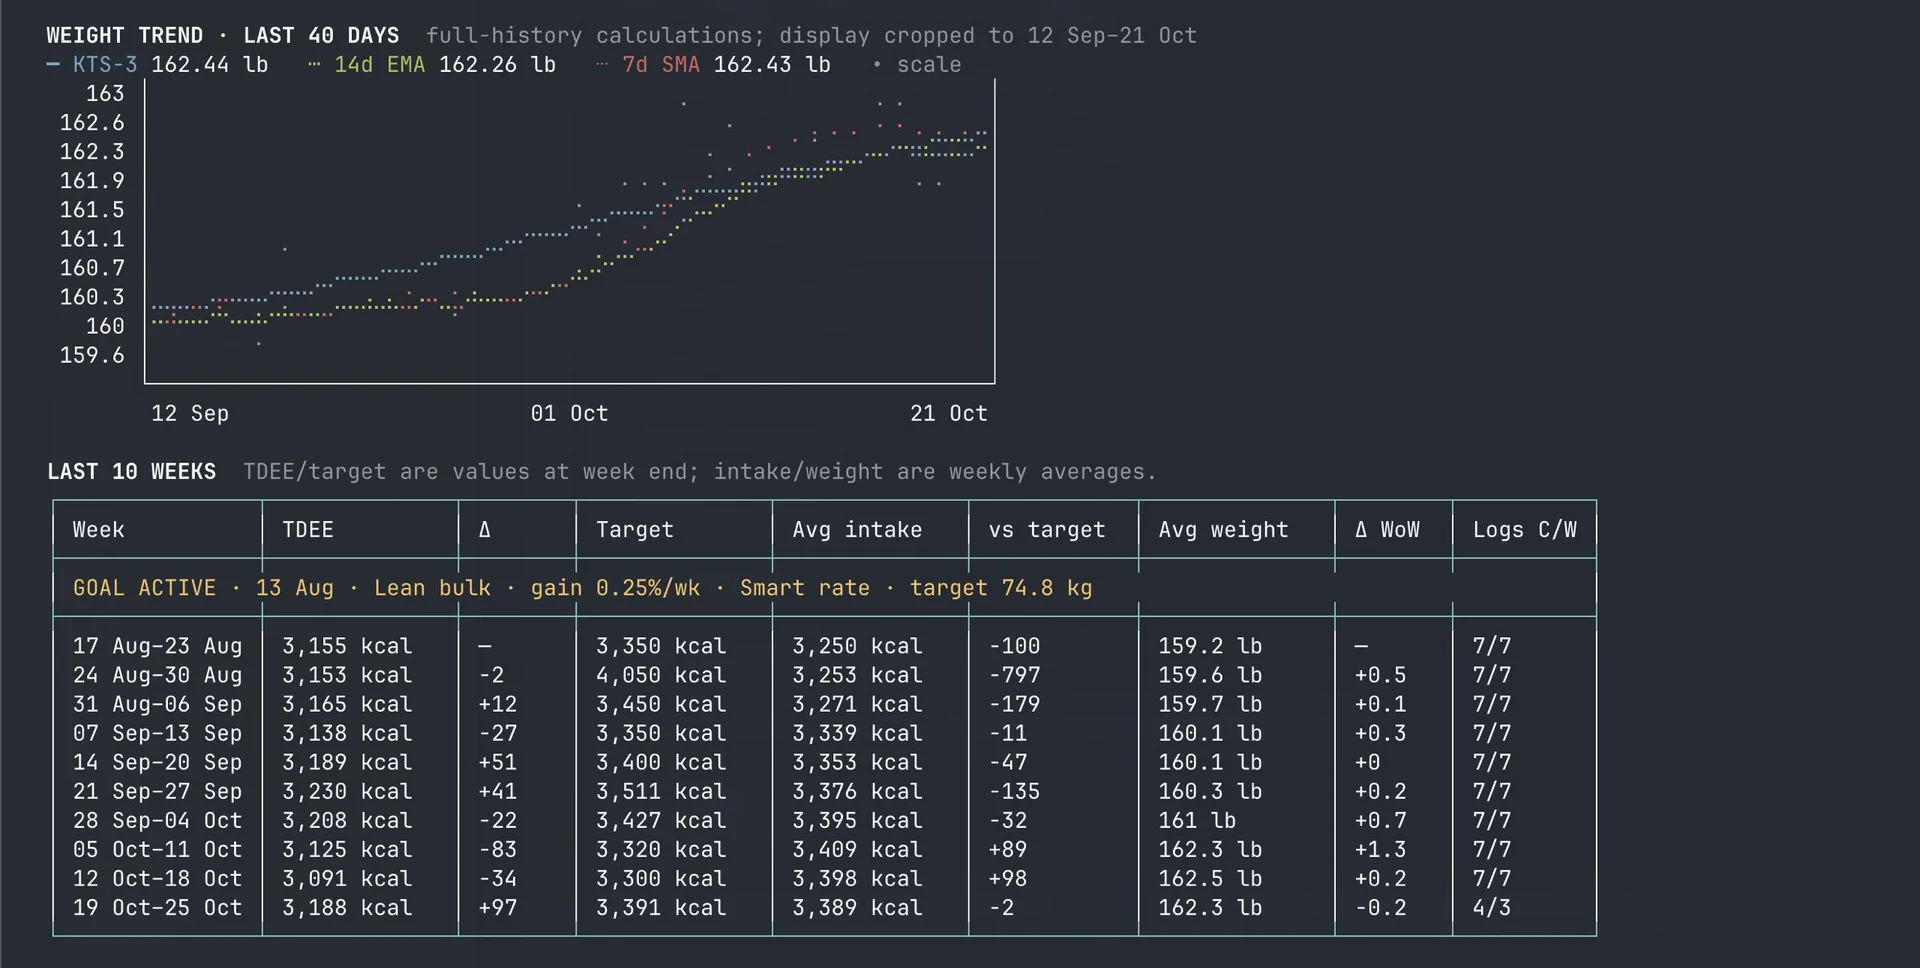
This user's weekly average weight rose from 159.2 lb to 162.3 lb across nine weekly intervals: a gain of 3.1 lb, or approximately 0.34 lb per week. That is about 0.22% of starting body weight per week, compared with the displayed goal of 0.25% per week.
Using the rough 3,500 kcal/lb conversion, that gain corresponds to an average surplus of about 172 kcal/day. This is why the maintenance estimate matters: an error of a few hundred calories can be larger than the surplus you intended.
Cut: follow the trend through the fluctuations
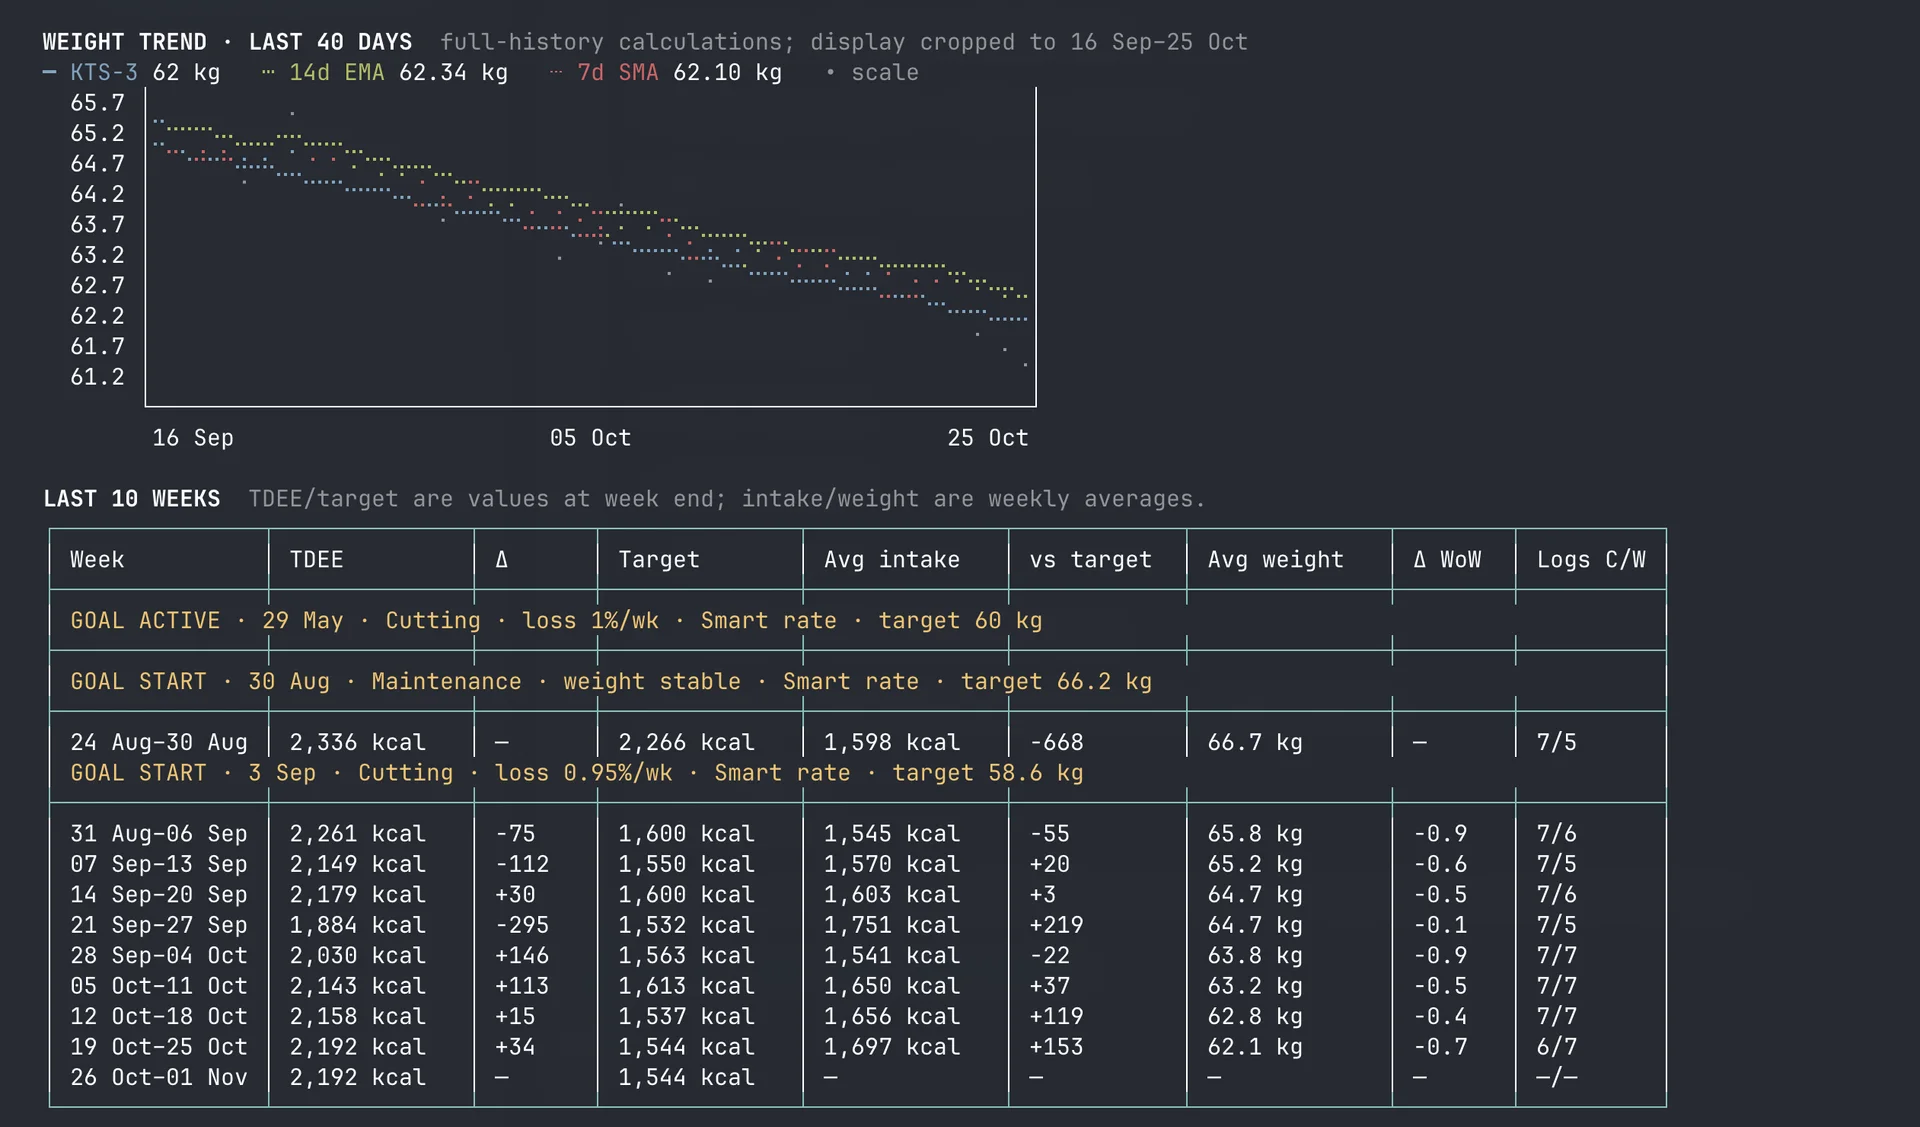
The first cut record shows 4.6 kg lost over eight weekly intervals, approximately 0.58 kg per week. The record includes goal changes and differences between recorded intake and the target, so it should not be read as eight weeks of following one fixed prescription.
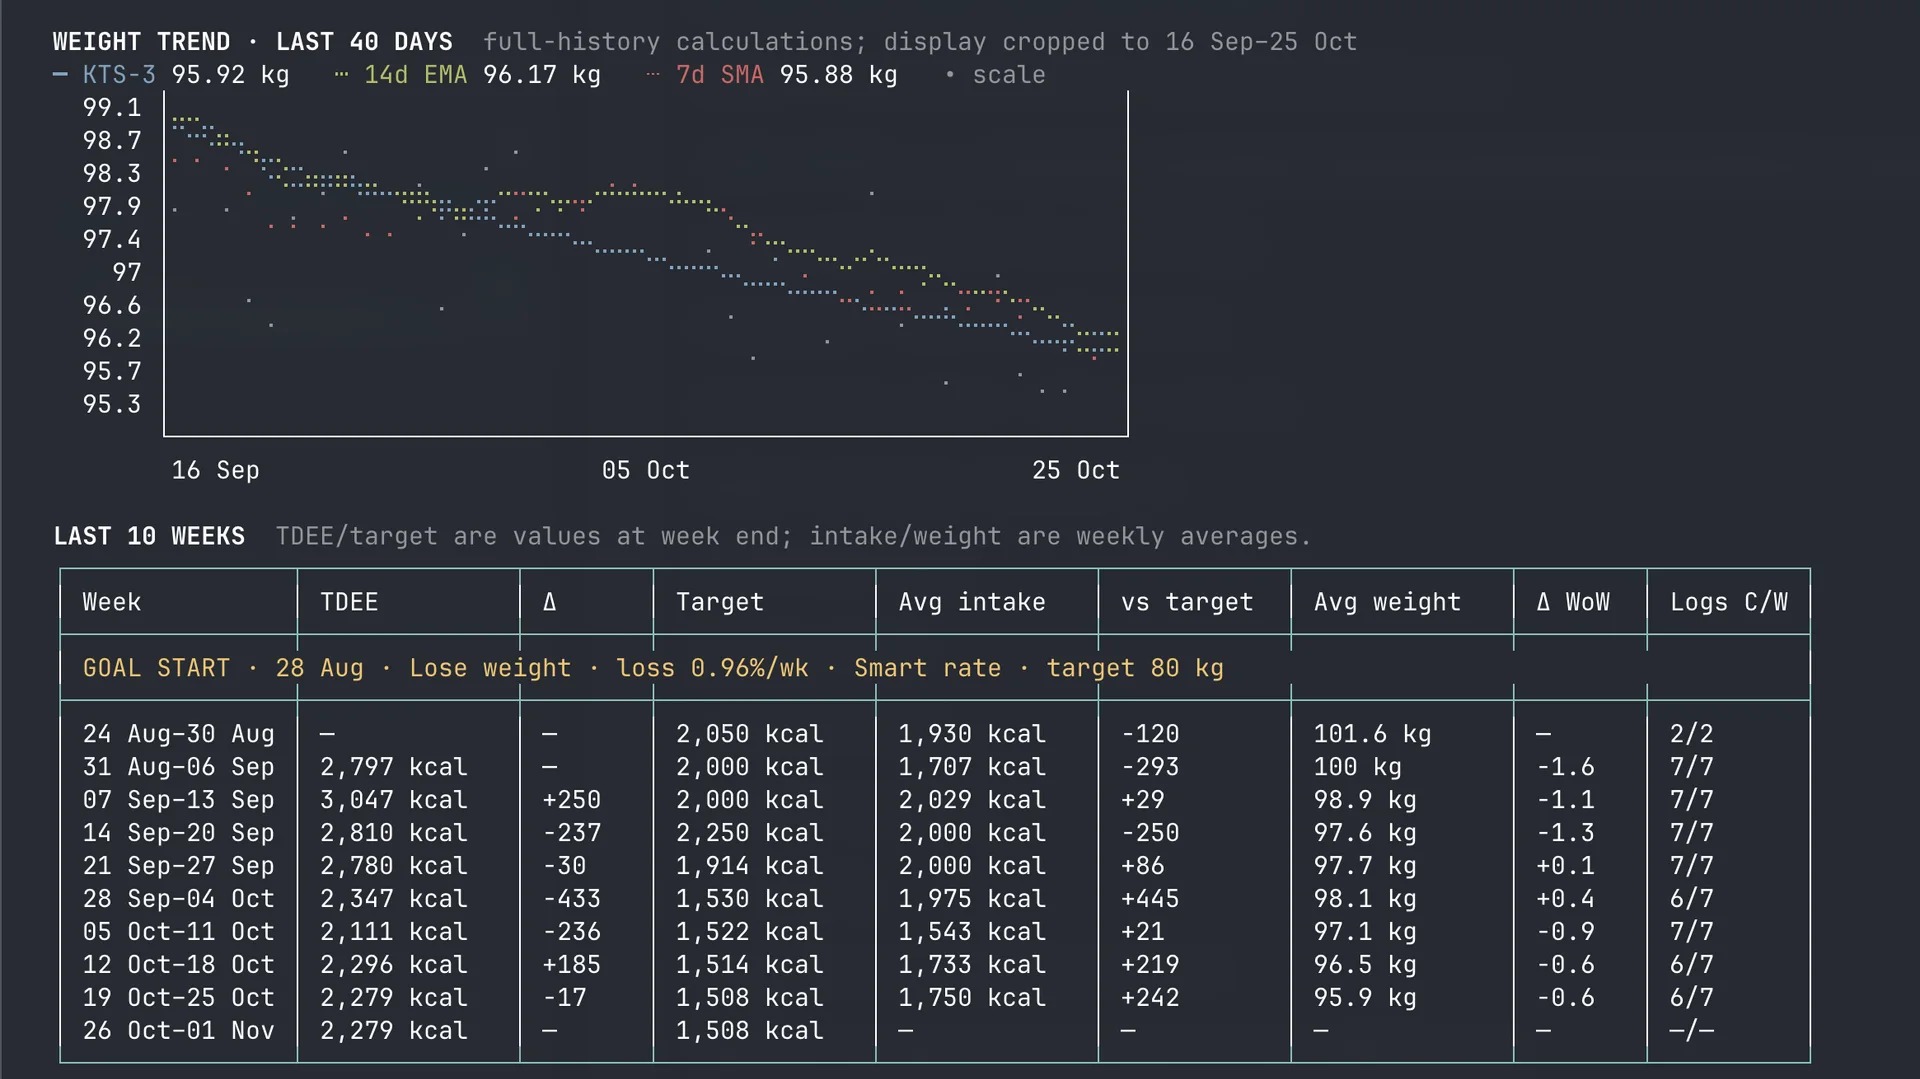
The second shows 5.7 kg lost over eight weekly intervals, approximately 0.71 kg per week. Some weekly averages rise before the downward trend resumes. A single week's movement would give a very different impression from the full record.
Maintenance: stability, and a case that drifts
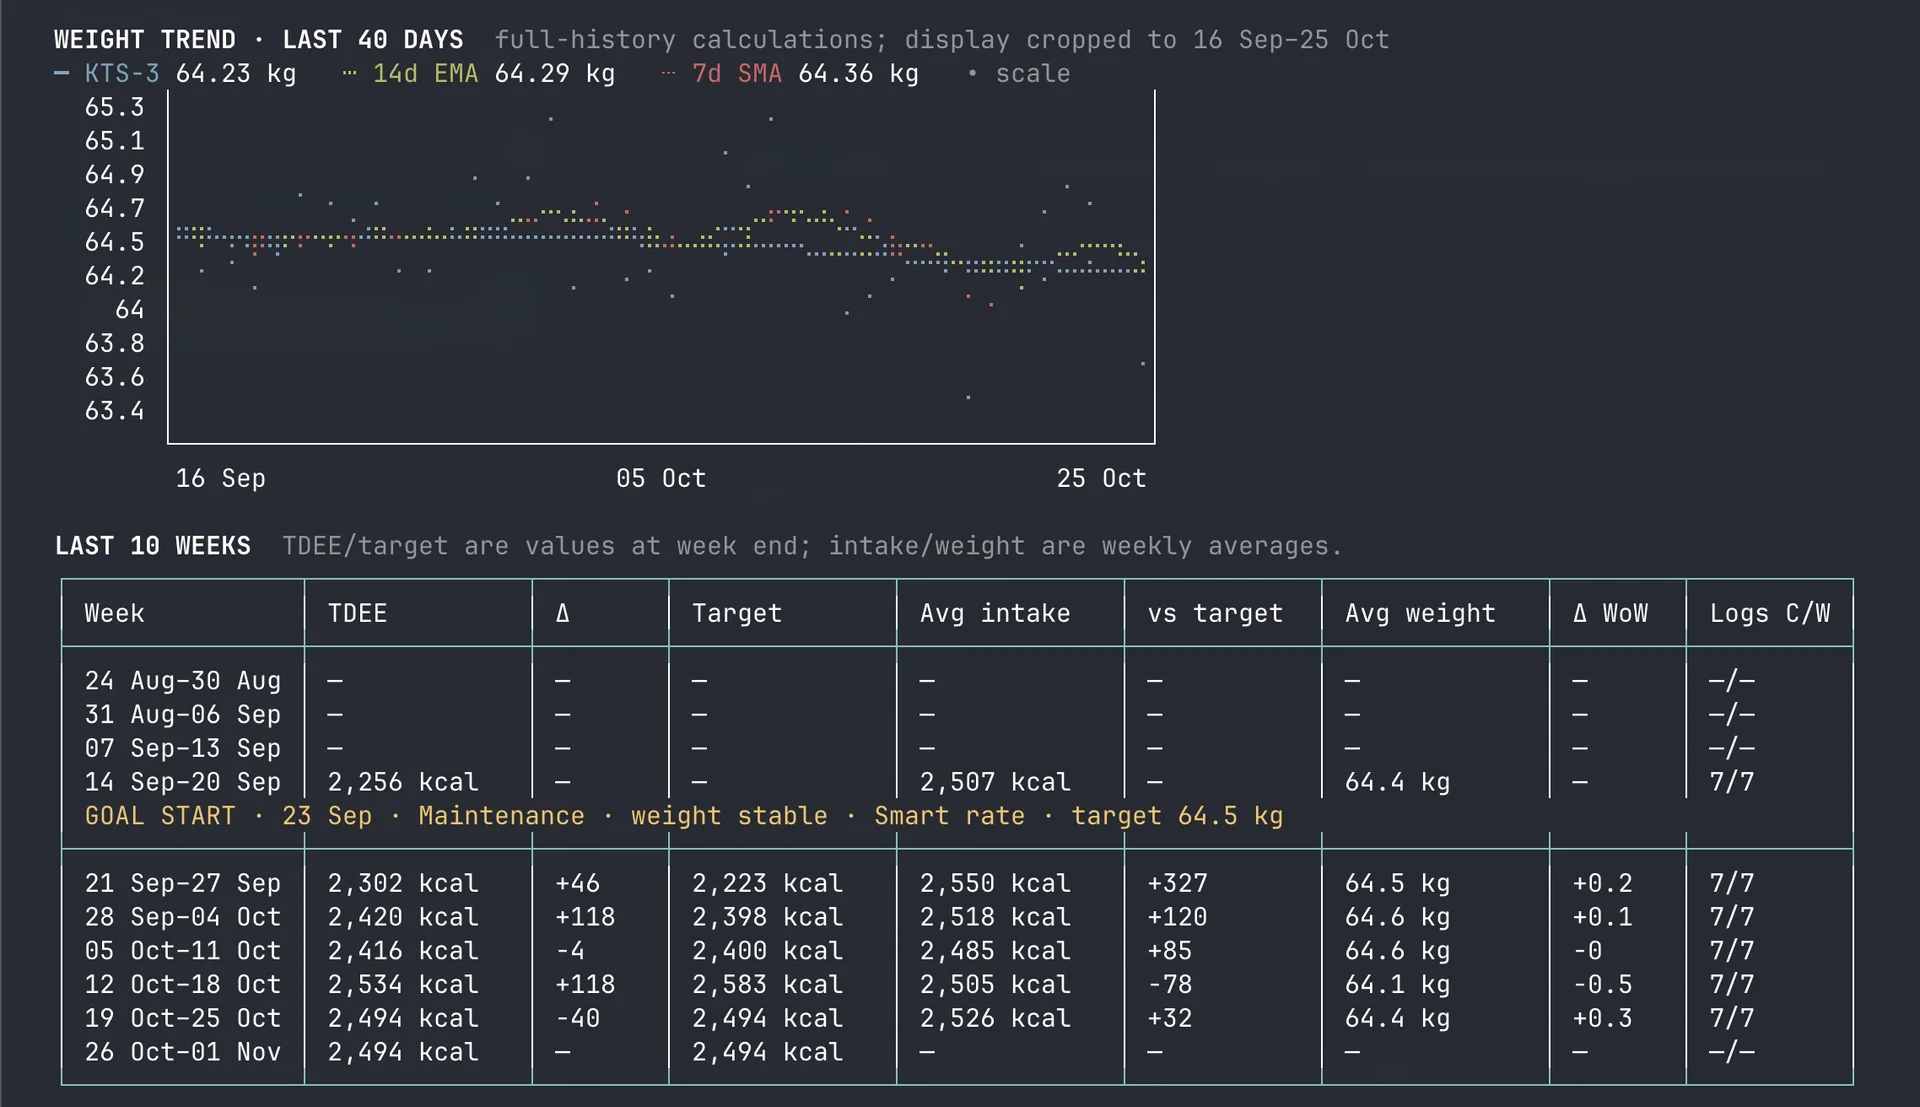
After the maintenance goal starts, the displayed weekly averages stay between 64.1 and 64.6 kg, around a 64.5 kg target. Day-to-day fluctuations remain, but the overall trend is relatively stable.
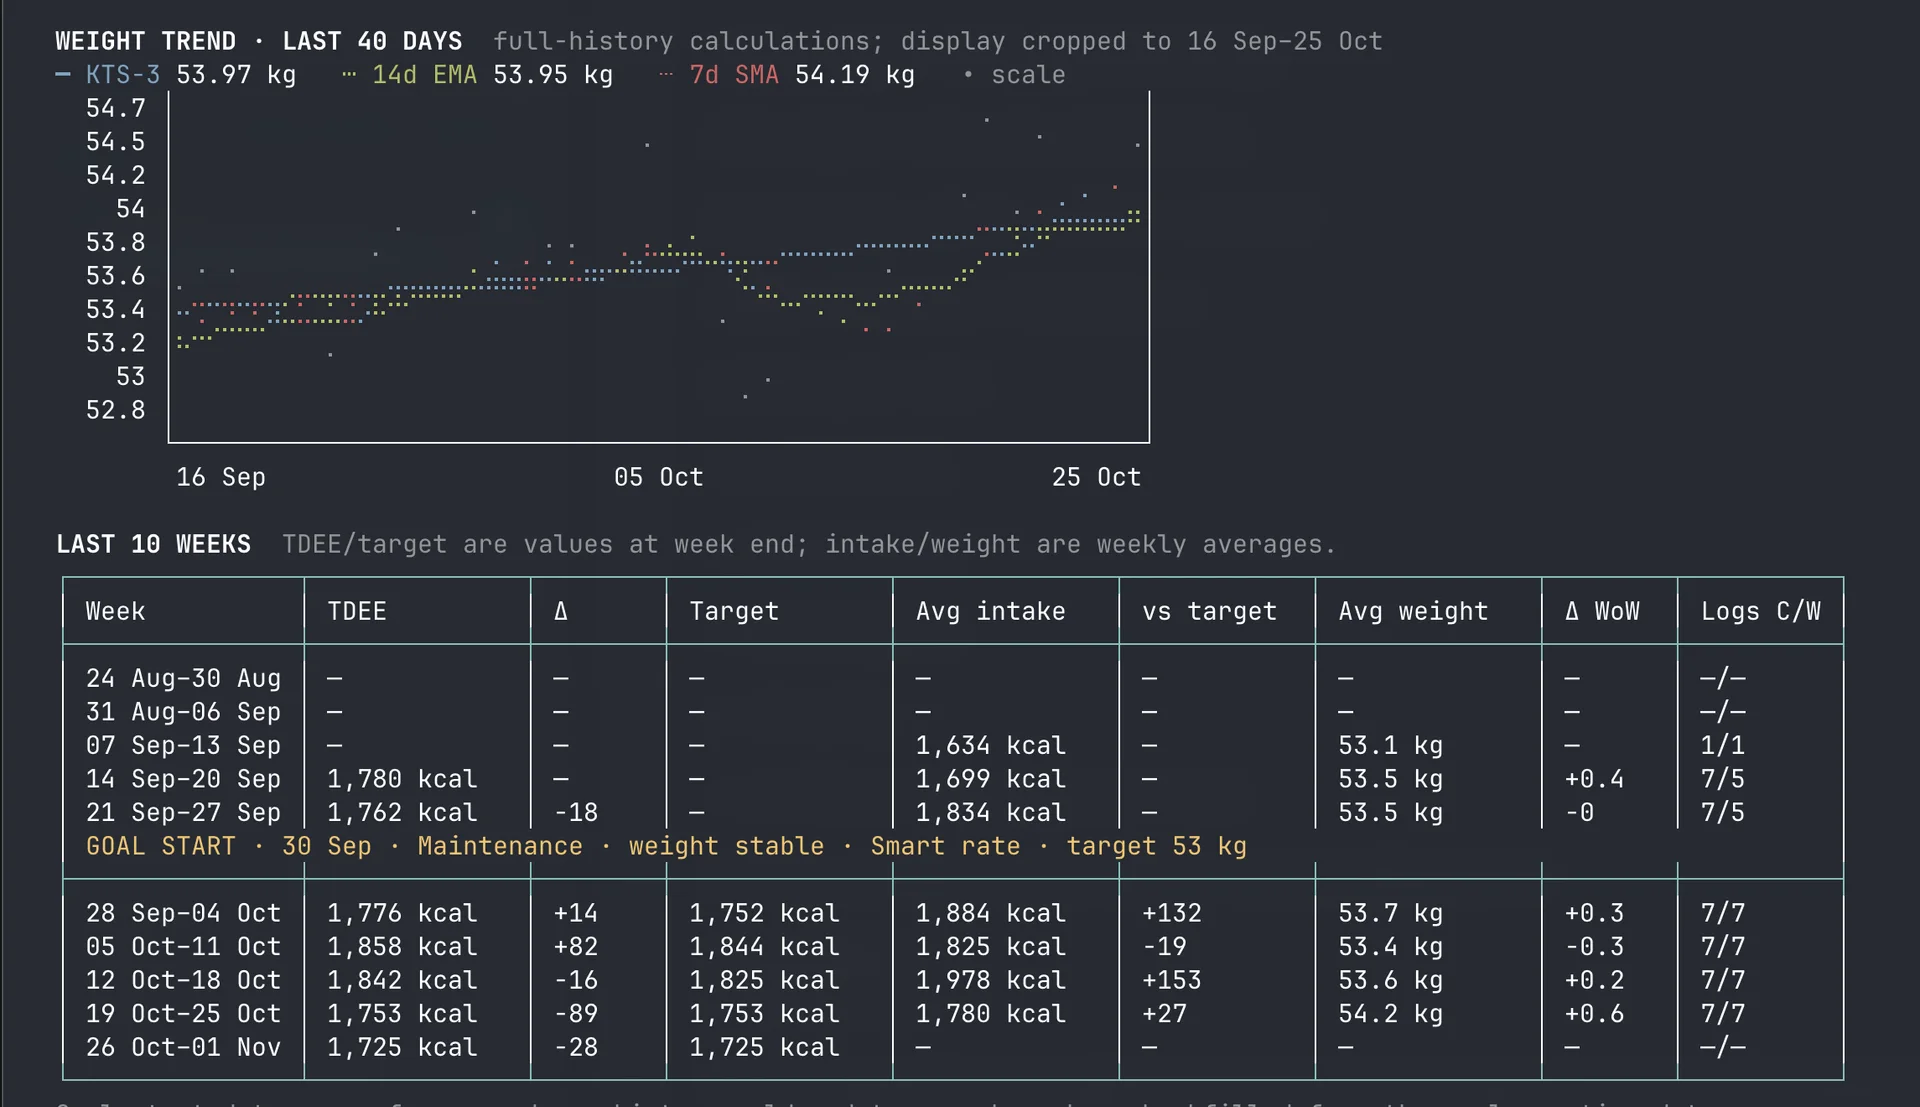
The second maintenance record shows upward drift: weekly average weight moves from 53.7 to 54.2 kg, with fluctuations in between and several weeks of recorded intake above target. It is useful to show this too. Selecting maintenance in an app does not ensure stable weight; the intake and the resulting trend still have to be checked.
The stronger test: predict what happens next
An accurate maintenance estimate should help you predict your future weight trend and choose an intake that produces your desired rate of loss or gain. Explaining weight changes after they happen is a weaker test.
For example, suppose your estimated maintenance is 2,500 kcal/day. With an intake of 2,000 kcal/day, the rough calculation predicts a loss of about 1 lb per week. Write that prediction down before the next tracking period, then compare it with the observed trend over several weeks. If the trend repeatedly misses the prediction, check the logs and revisit the expenditure estimate. Normal water-weight changes still make exact daily scale weights unpredictable.
In our experience, people who set their food targets using calorie-burn estimates from Apple Watch or Garmin often fail to achieve their intended rate of weight loss or gain. That is our experience, rather than the result of a controlled comparison.
Apply the same test to Apple Watch or Garmin. Use its estimated total daily expenditure, rather than exercise or active calories alone, and compare the implied weight change with what actually happens. If its burn estimate is too high or too low for you, following a target derived from it will miss your intended rate of loss or gain. A precise-looking calorie number does not establish that it can predict your results.
The advantage of an adaptive approach is that it keeps checking and updating the estimate against your intake and weight history. The practical question is whether those updates improve predictions for subsequent weeks and help you stay near your chosen rate.
These selected records show observed outcomes, not a measured forecast-error comparison with Apple Watch or Garmin. They do not establish a specific accuracy advantage over either device. To demonstrate that, we would need predictions recorded in advance from each method for the same users, followed by a comparison with their later weight trends.
You can access the MacroCodex app for free. There are no paywalls, subscriptions, ads, or upsells.
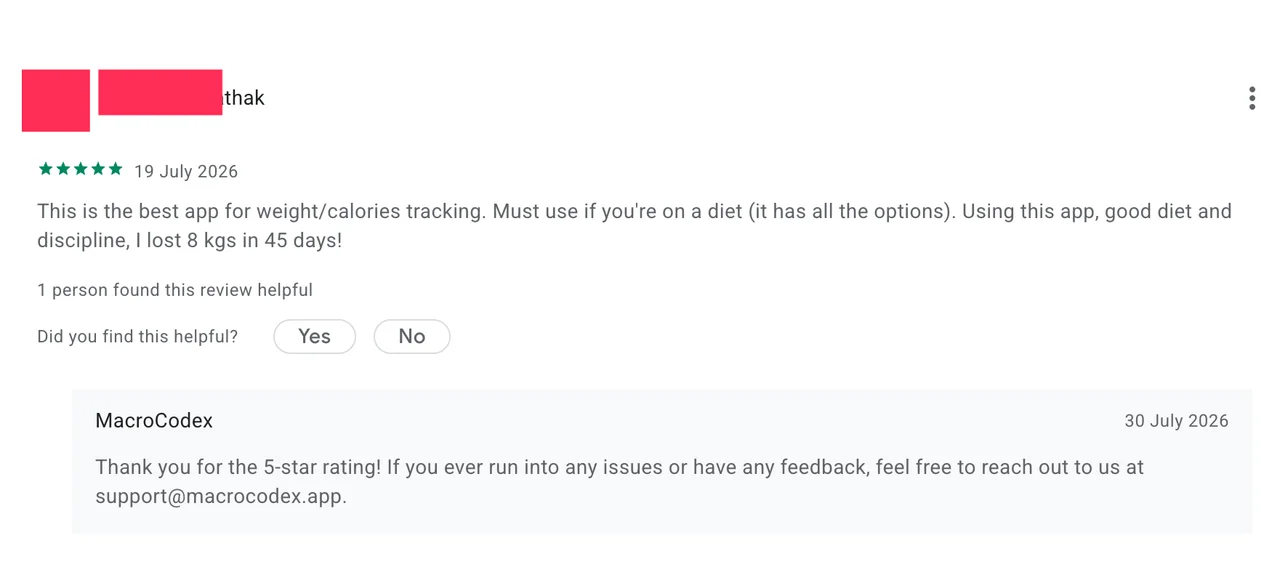
Our claim: See measurable weight gain or weight loss results within 2–3 weeks of using MacroCodex. Many users start seeing results as early as the first week.
Verify playstore reviews here: https://play.google.com/store/apps/details?id=com.macrocodex.app
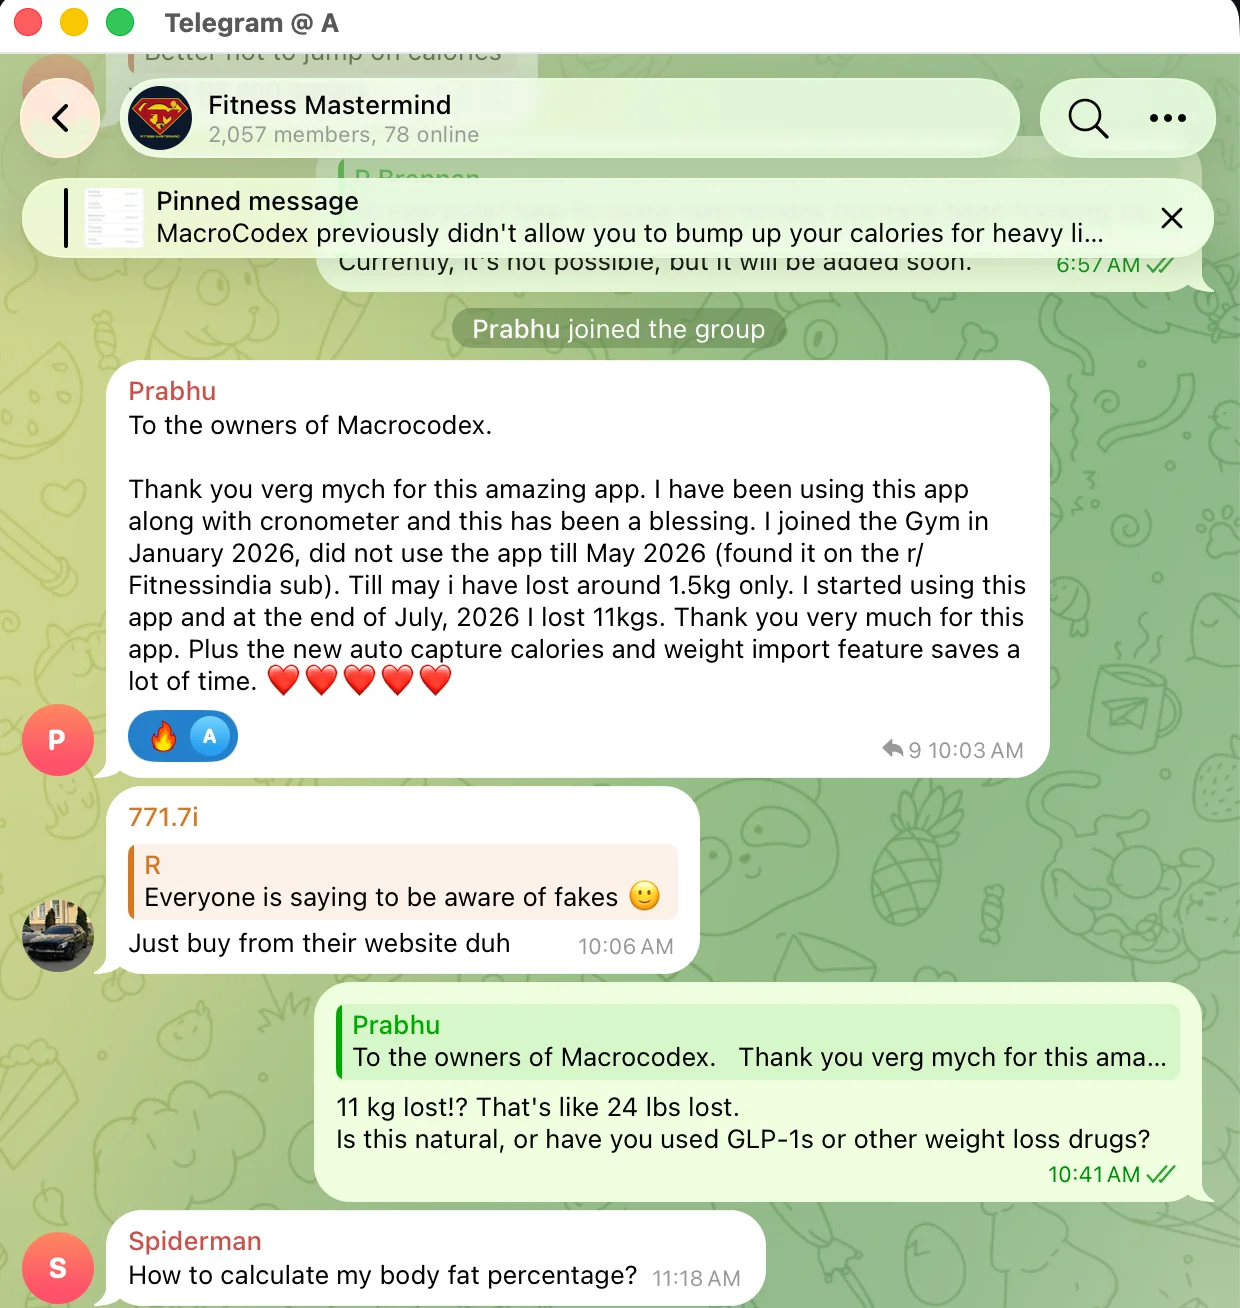
Verify Telegram Community reviews here: https://macrocodex.app/community/